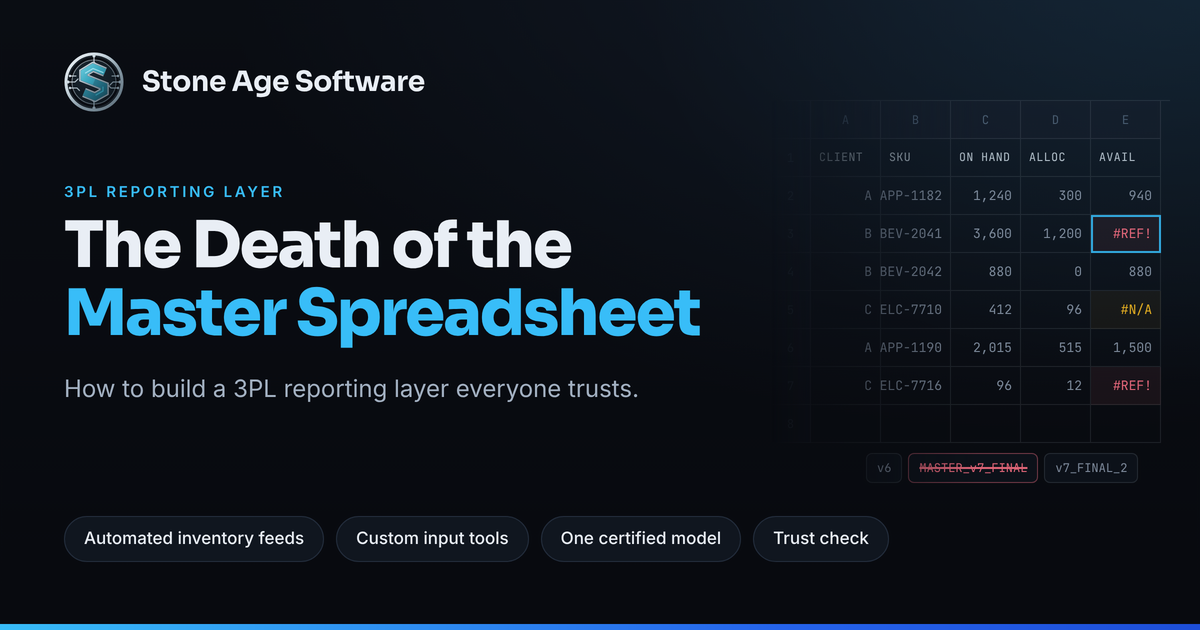
The master spreadsheet takes four minutes to open. It is 6:15 on a Monday, and every client expects numbers by 8:00. Someone pastes three fresh CSV exports into the raw tabs and clicks the macro button. If the WMS export gained a column over the weekend, the macro stops with an error. If it runs, the morning goes on.
That workbook is often the most important system in a multi-client warehouse. It just is not built like one. A 3PL reporting layer is what replaces it: automated feeds, one written definition per number, and real tools for the data people type in by hand. Here is how to build one that the floor, billing, and every client can trust.
The timing matters this fall. The October 2026 Logistics Managers' Index, released November 3, showed inventory levels growing at the fastest pace since September 2022. Inventory costs posted their highest reading since March 2022. The researchers tied much of the jump to retailers stocking up for holiday sales. DC Velocity reported that the buildup is already cutting into available storage.
More stock and tighter space mean more questions from clients. What do I have? What is on hold? What is aging? At a lot of 3PLs, every one of those answers still runs through one workbook.
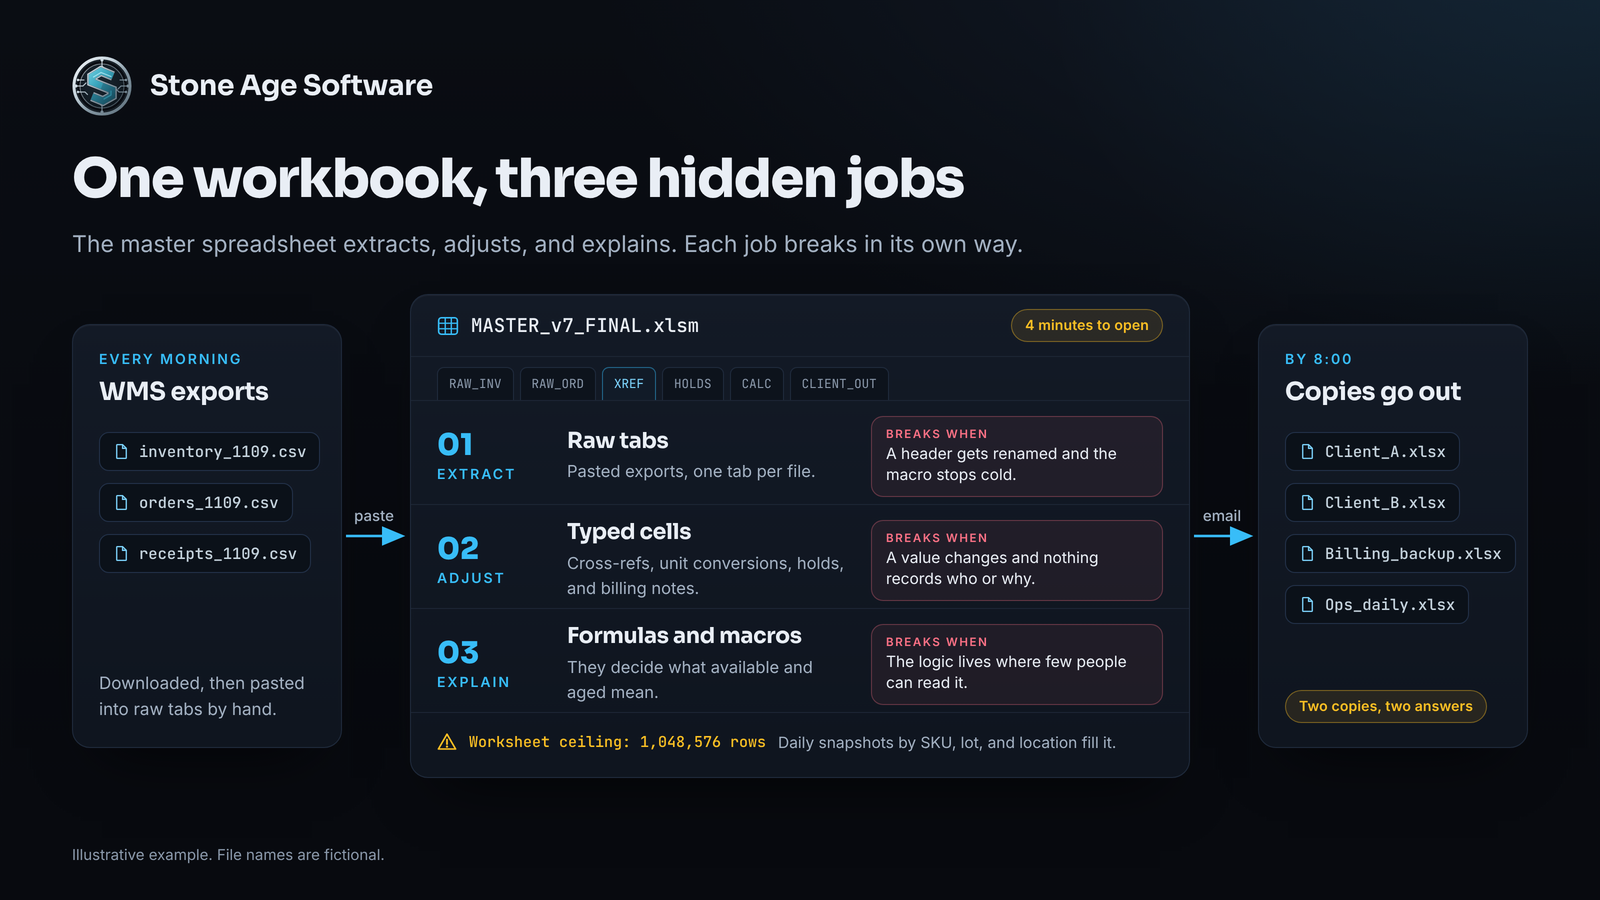
The three jobs the master spreadsheet quietly does
A WMS is built to run the floor, and most run it well. Cross-client reporting is a different job. So the gap gets filled by the tool everyone already has open.
Over time, the master spreadsheet takes on three jobs:
- Extract. Manual CSV exports from the WMS get pasted into raw tabs every morning.
- Adjust. People type into cells for SKU cross-references, unit conversions, hold reasons, and billing notes.
- Explain. Formulas and macro logic decide what "available" or "aged" means.
Each job has its own way of breaking:
- Exports change shape. A renamed header or a new column stops the macro cold.
- Sheets run out of room. Excel tops out at 1,048,576 rows per worksheet. A daily snapshot by SKU, lot, and location can fill that in a few months.
- Typed changes have no history. When a number moves, nothing records who changed it or why.
- Copies multiply. One "final" version sits on the shared drive, a newer one sits in an inbox, and two people give two answers.
None of that is a people problem. It is a structural one. One file is being asked to act as an integration, a database, and a rulebook at the same time.
What a 3PL reporting layer actually does
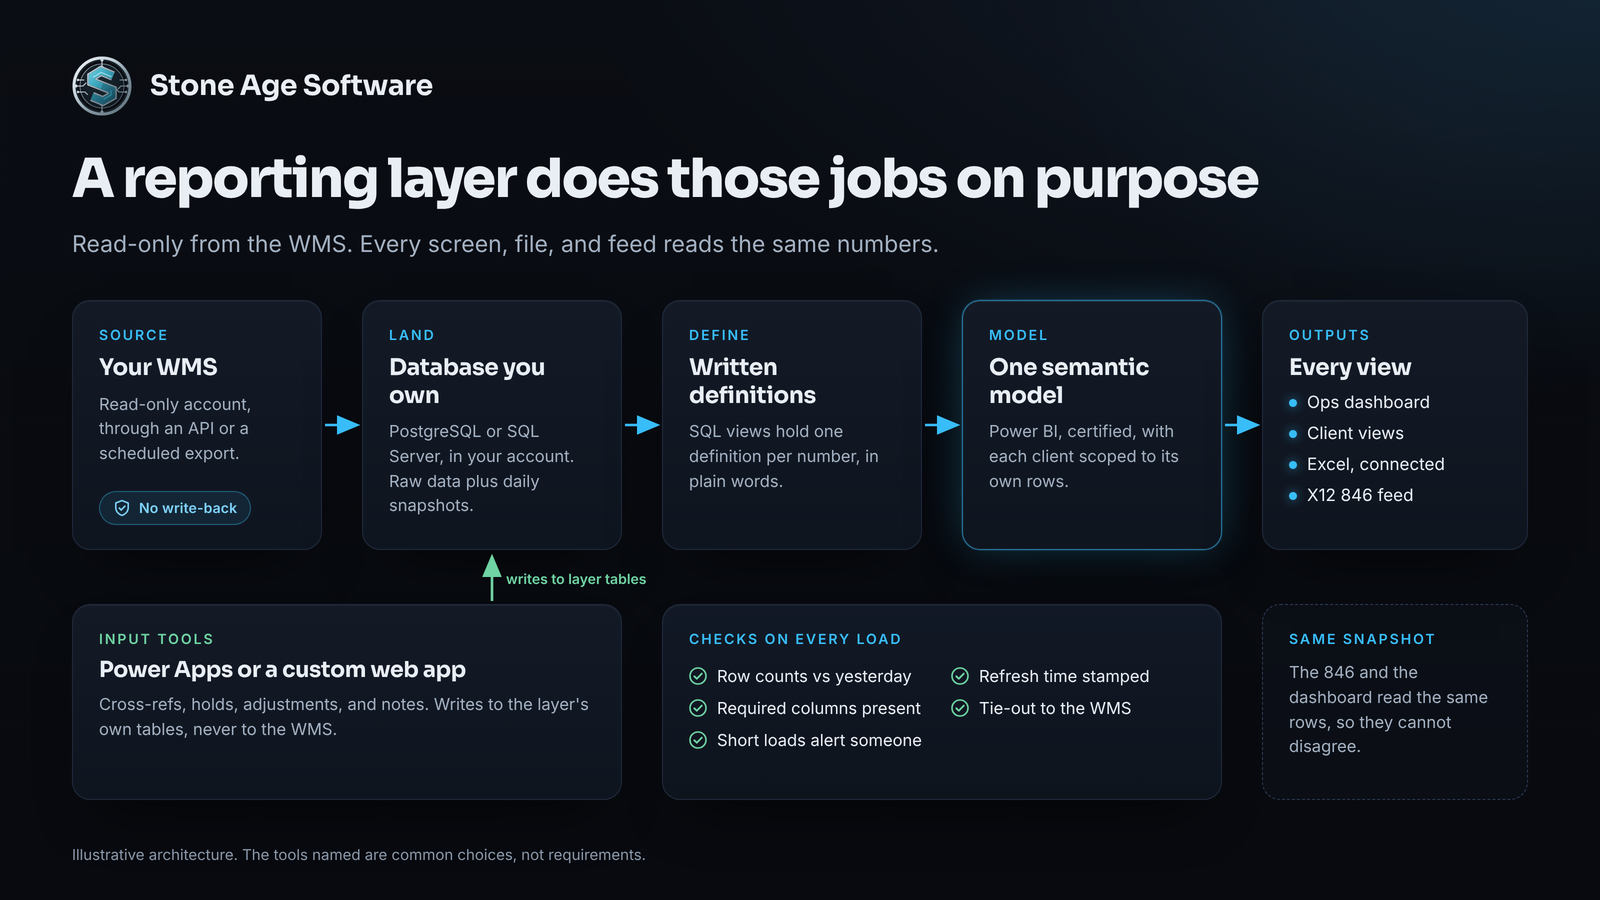
A reporting layer does those same three jobs on purpose, in software built for them. It sits beside the WMS. It reads from the WMS and never writes back.
The pieces stack up like this:
- Automated extracts. A read-only connection pulls data on a schedule. It uses an API where one exists and a scheduled export where it does not.
- A database you own. Raw data lands in PostgreSQL or SQL Server, in an account with your name on it.
- Daily history. Snapshots keep yesterday's on-hand, so "what did we have on the 3rd?" has an answer.
- Written definitions. SQL views hold one definition per number, documented in plain words.
- One semantic model. Power BI sits on top with shared measures and client scoping.
- Input tools. Power Apps or a small web app captures the data people used to type into tabs.
- Outputs. Dashboards, client views, scheduled files, and EDI feeds all read the same numbers.
Step 1: Automate the inventory feed
Inventory data automation starts with boring, reliable plumbing. Get read-only access. Land the raw data first and shape it second. Keep the client or owner code on every row, because everything downstream depends on it.
Then add the habits a person used to perform by eye:
- Snapshot daily. The WMS shows the present. History only exists if you save it.
- Check every load. Compare row counts to yesterday, confirm required columns exist, and stamp the refresh time.
- Fail loudly. A short or late load should alert someone before a client sees a stale number.
- Tie out to the source. Each morning, compare a handful of SKUs per client against the WMS screen.
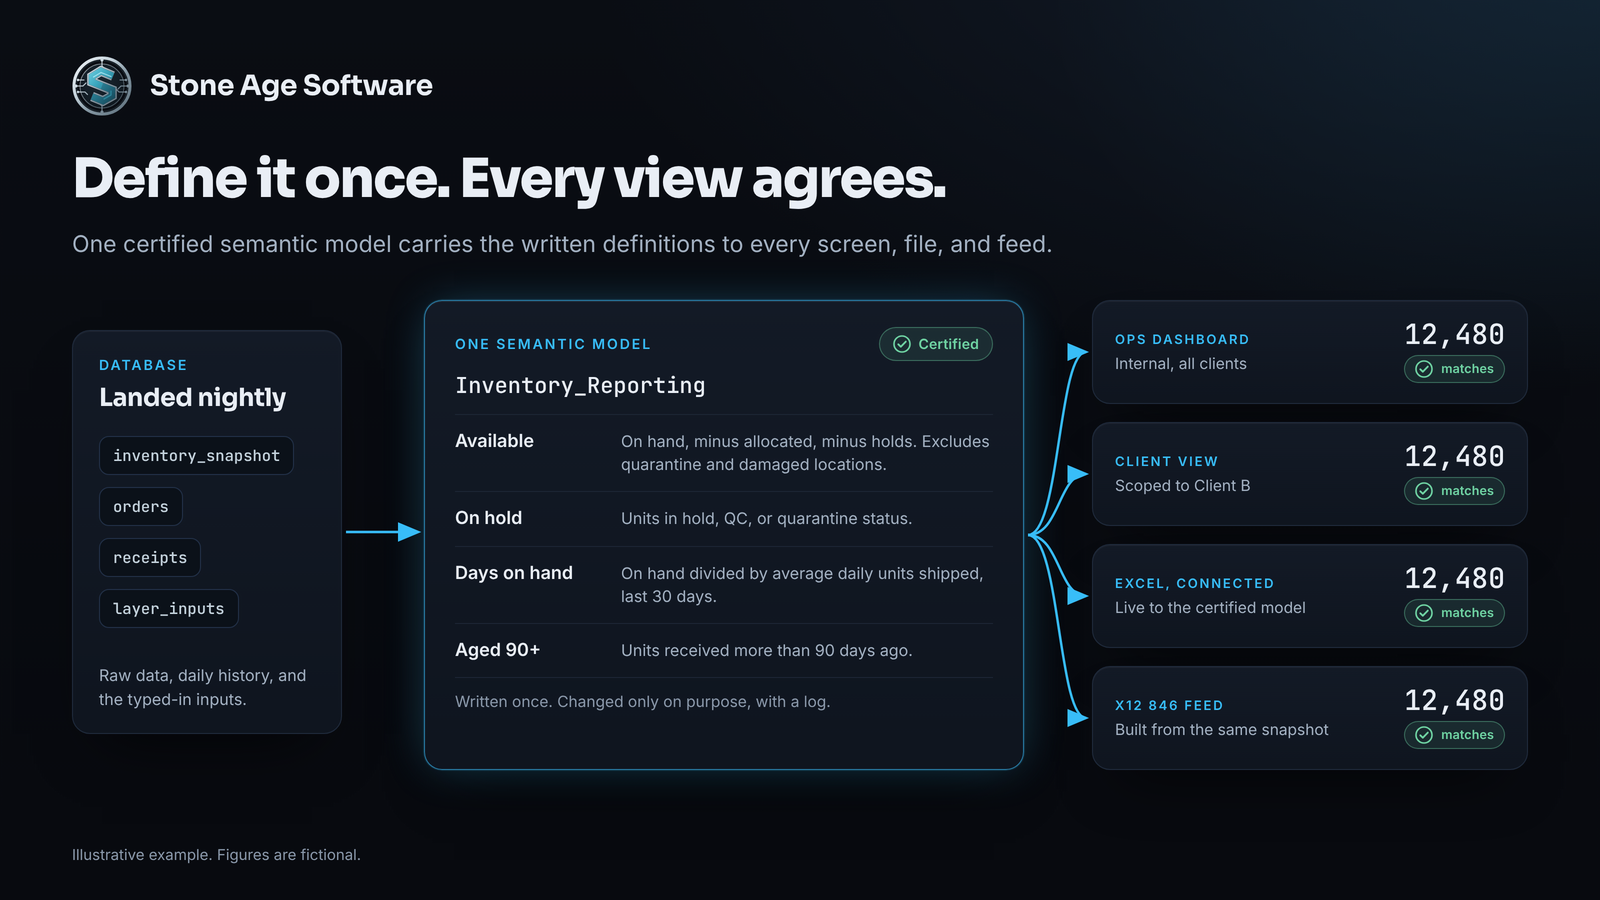
One more rule pays off fast. Some clients receive an X12 846 Inventory Inquiry/Advice from you. Build that file from the same snapshot that feeds their dashboard. Then the EDI number and the screen cannot disagree.
Step 2: Model it once in Power BI
Build one Power BI semantic model for every client. Define each measure once: on hand, allocated, available, on hold, and days on hand. Write the definition beside it in plain words.
Here is an example. "Available equals on hand, minus allocated, minus holds. Quarantine and damaged locations are excluded." When billing, operations, and a client all read that sentence, the argument is over before it starts.
Scope each client to its own rows with row-level security. We walked through that build, and the leak test, in one Power BI model for 3PL client reporting.
Then mark the model as the source. Power BI's endorsement feature lets reviewers chosen by your administrator certify a semantic model. Microsoft describes certified content as reliable, authoritative, and ready for use across the organization.
Excel does not have to go away. People can still open Excel and connect it to the certified model. The spreadsheet becomes a window onto one source instead of a source of its own.
Step 3: Give the typed-in data a real home
Inputs are the part most rebuilds miss. If the SKU cross-reference still lives in a tab, the master spreadsheet lives too.
List every cell someone types into today. Common ones include:
- Client SKU cross-references and unit-of-measure conversions
- Hold and quarantine reasons
- Adjustments waiting on a correction in the WMS
- Special-handling notes that feed your invoicing/accounting integration
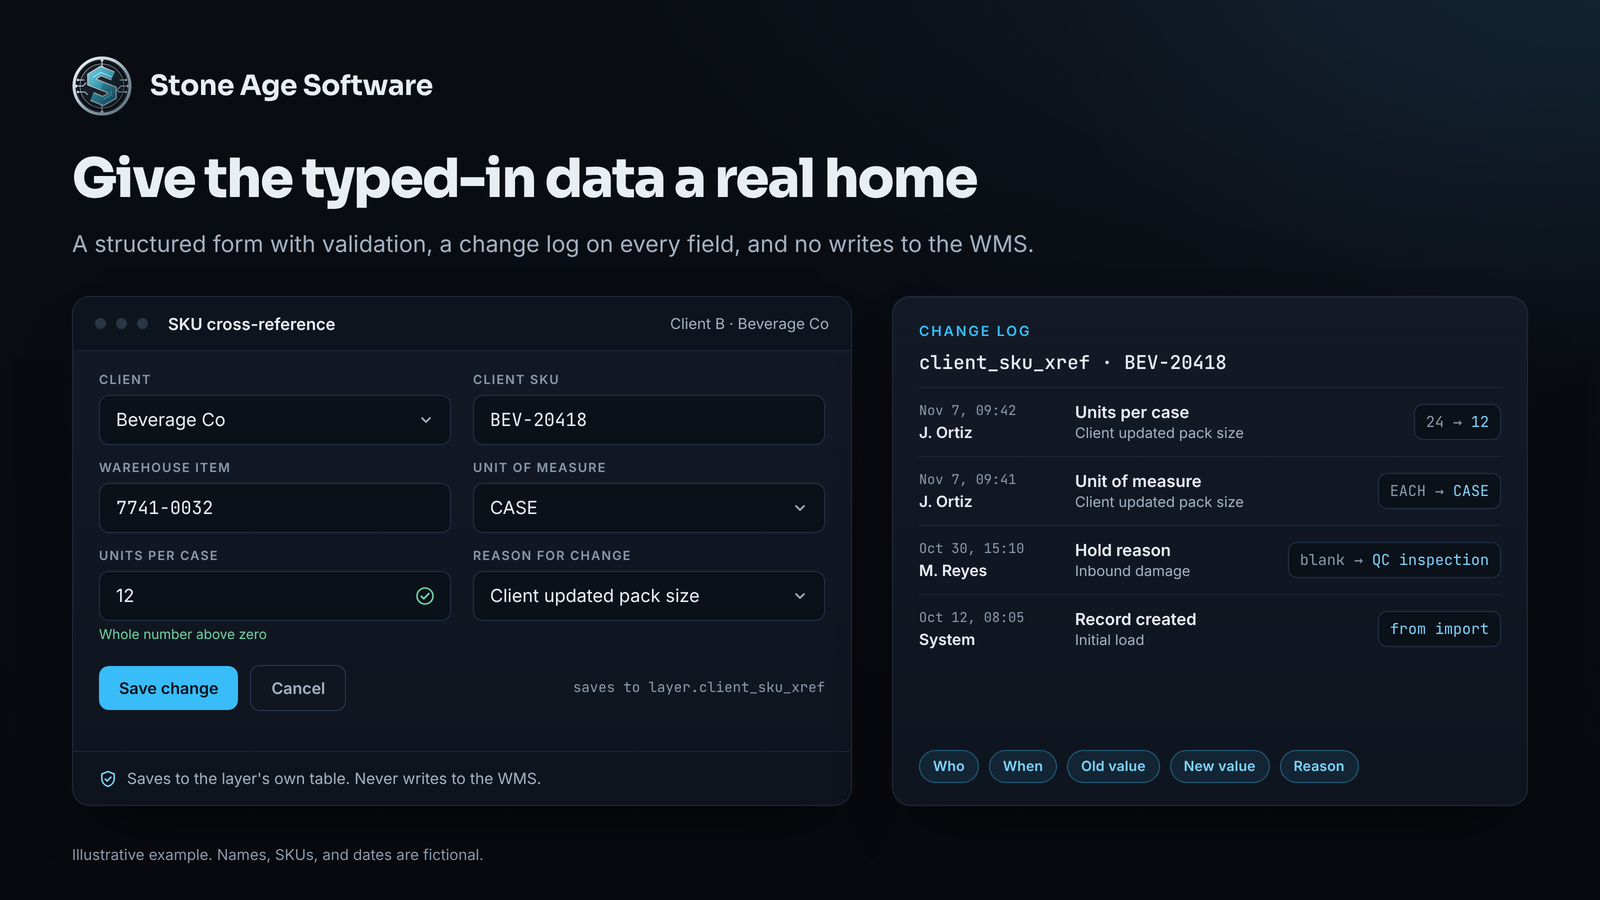
Then give each one a structured form. Use Power Apps when users live in Microsoft 365 and the form is simple. Microsoft's Power Apps visual can even embed an app in a report, filtered like any other visual. Build custom warehouse tools as a small web app when you need complex validation, client access, or scanner screens.
Either way, the rules are the same:
- Writes go to the layer's own tables, never to the WMS.
- Every save records who, when, the old value, and the new value.
- Dropdowns replace free text, and blanks fail validation.
That change log is where trust comes from. On a variance reconciliation register we built, every line keeps its first-seen date. Twelve fields are change-logged, and only the system can close a line.
Retire the sheet one tab at a time
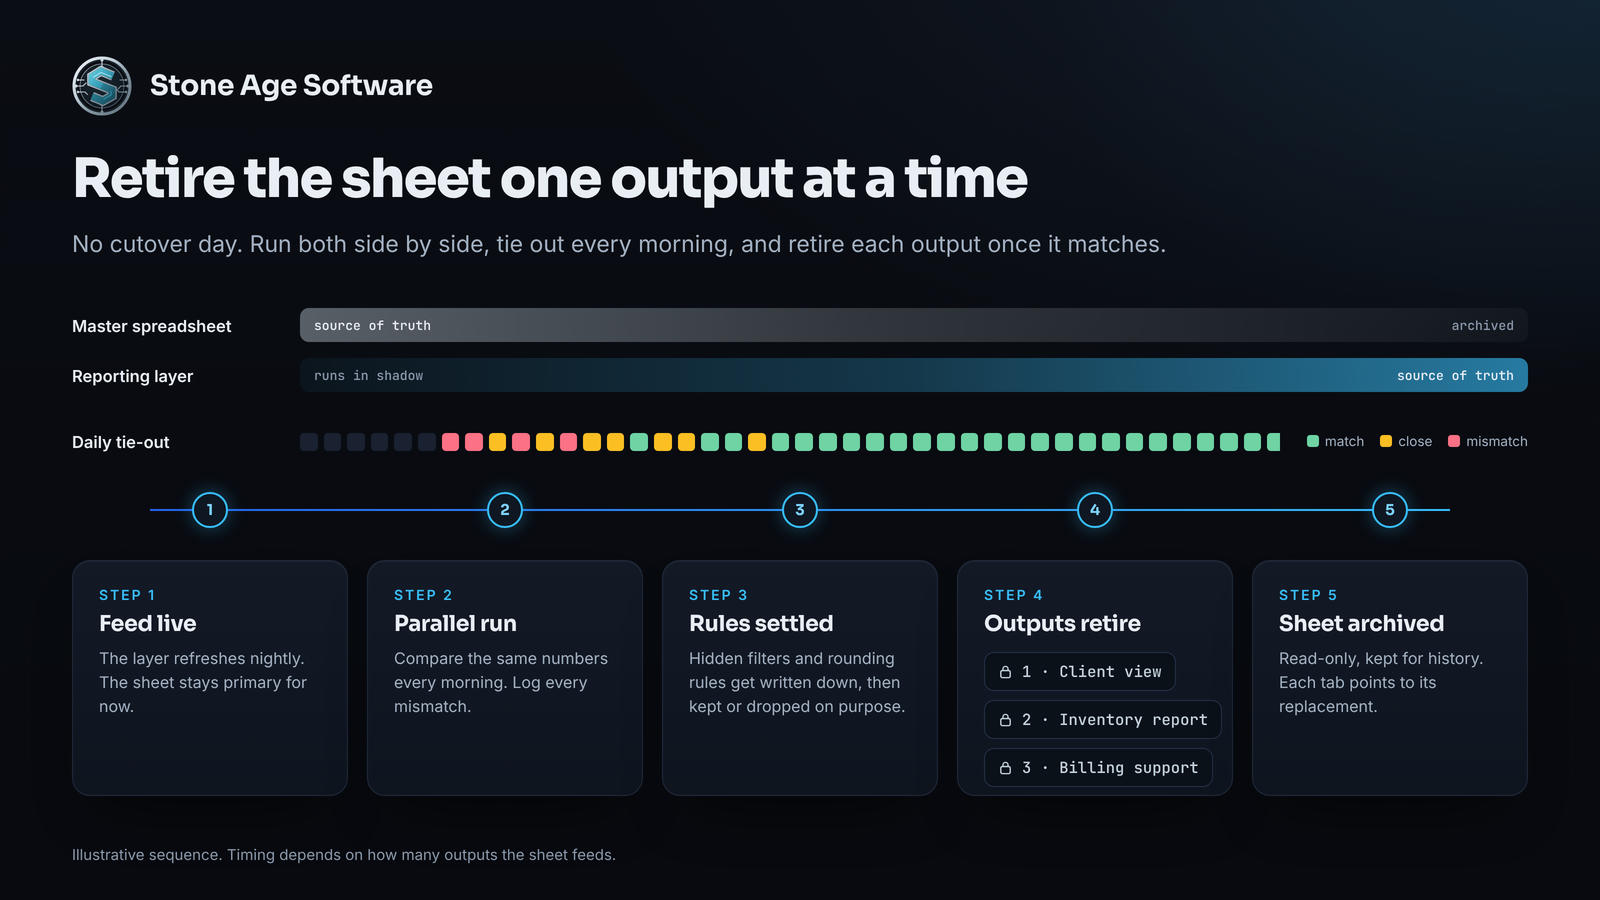
Do not schedule a cutover day. Run the layer beside the spreadsheet and compare the same numbers every morning.
When they disagree, find out which one is right. Often the spreadsheet carried a filter or rounding rule nobody wrote down. Write it down, then decide on purpose whether to keep it.
Retire outputs one at a time. Start with one client view, then the internal inventory report, then billing support. Lock each retired tab as read-only, with a note that points to its replacement.
We took the same path on a multi-year operations platform. One application replaced a warehouse's spreadsheets one module at a time. Each old system retired the day its module shipped.
What changes for the people who ran the sheet
The person who kept the macro alive is not replaced. They become the owner of the definitions. Their mornings move from pasting exports to working exceptions. That means the short ship, the hold that should have cleared, and the client asking why aged stock jumped.
That is the real payoff. Software handles the repeatable steps. People keep the judgment calls.
A 15-minute trust check you can run this week
Pick one client and one number, such as available units for their top ten SKUs. Then:
- Pull it from the master spreadsheet.
- Pull it from the WMS screen.
- Pull it from whatever the client last received, such as the 846, an emailed file, or a portal.
- Write down the definition each source used.
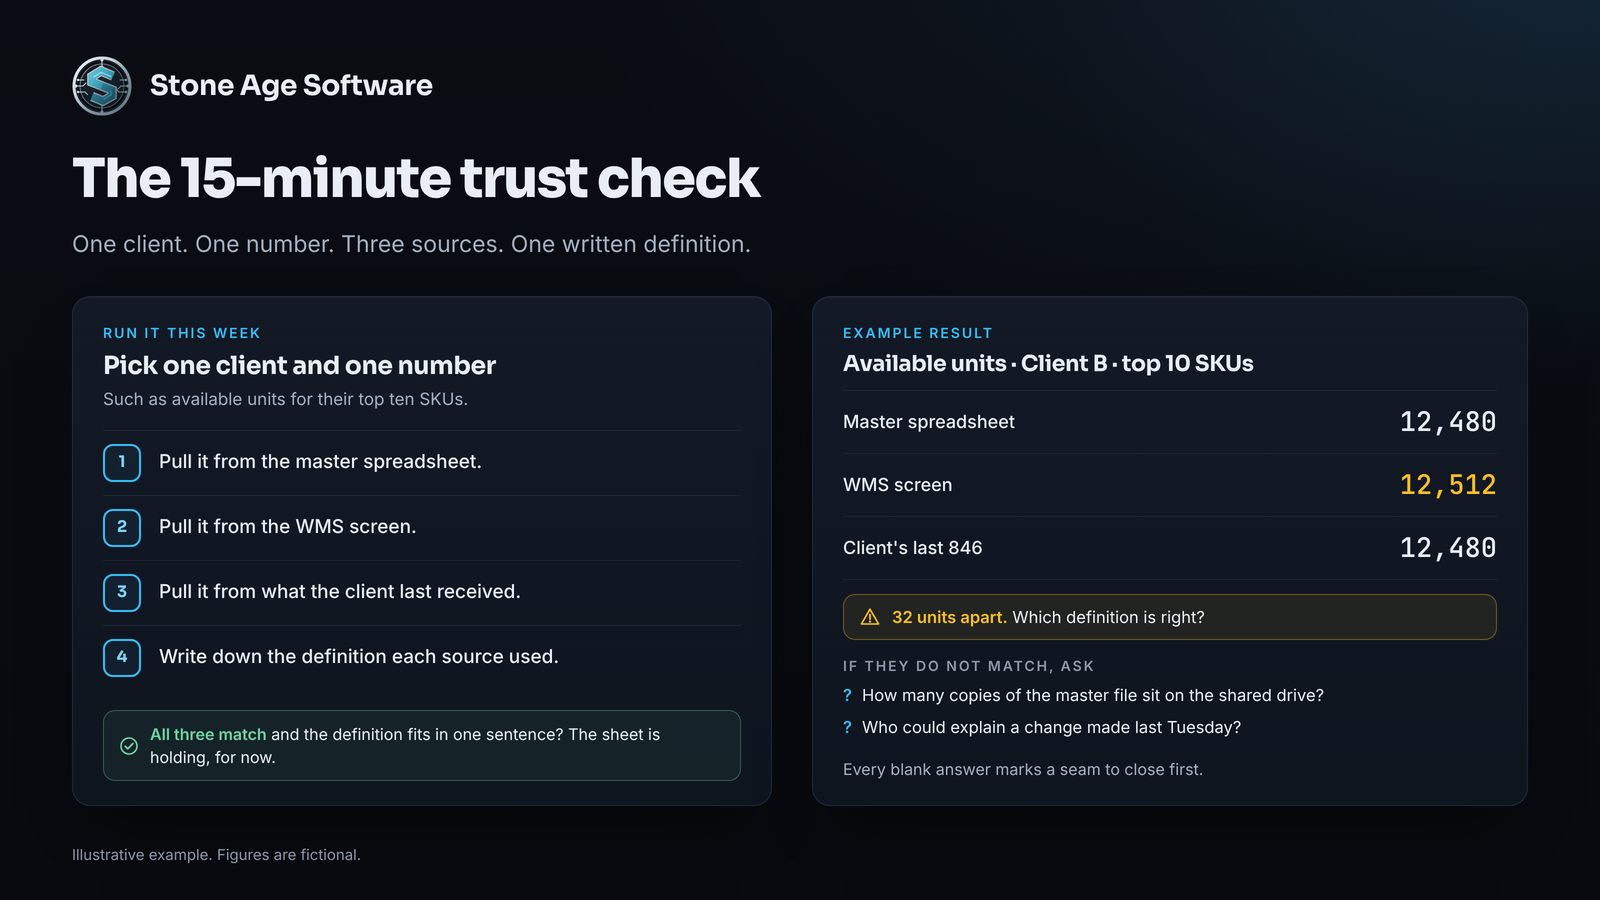
If all three match and you can state the definition in one sentence, your sheet is holding for now. If they do not, count the copies of the master file on your shared drive. Then ask who could explain a change made last Tuesday. Every blank answer marks a seam your reporting layer should close first.
Stone Age Software builds the 3PL reporting layer beside the WMS you already run. That means read-only extracts, a database in your account, one certified model, and the input tools your team needs. Every engagement is fixed price, quoted up front.