On October 6, the Logistics Managers' Index reported warehousing capacity contracting at its fastest rate since March 2022. Inventory costs kept climbing. In many companies, that signal reached the executive team as one line on page eleven of a monthly deck. Finance saw it in one file. Operations saw it in another. Sales heard about it from a customer.
That is data drowning. Power BI dashboards fix it only when each one answers a single question in five seconds. The cause is structural: dozens of exports that never meet, each correct alone and useless together. The cure is consolidated visual storytelling, with one screen per question and one definition per number. Here are the five views every executive team should see, with the visuals, a wireframe and the decision each one should drive.
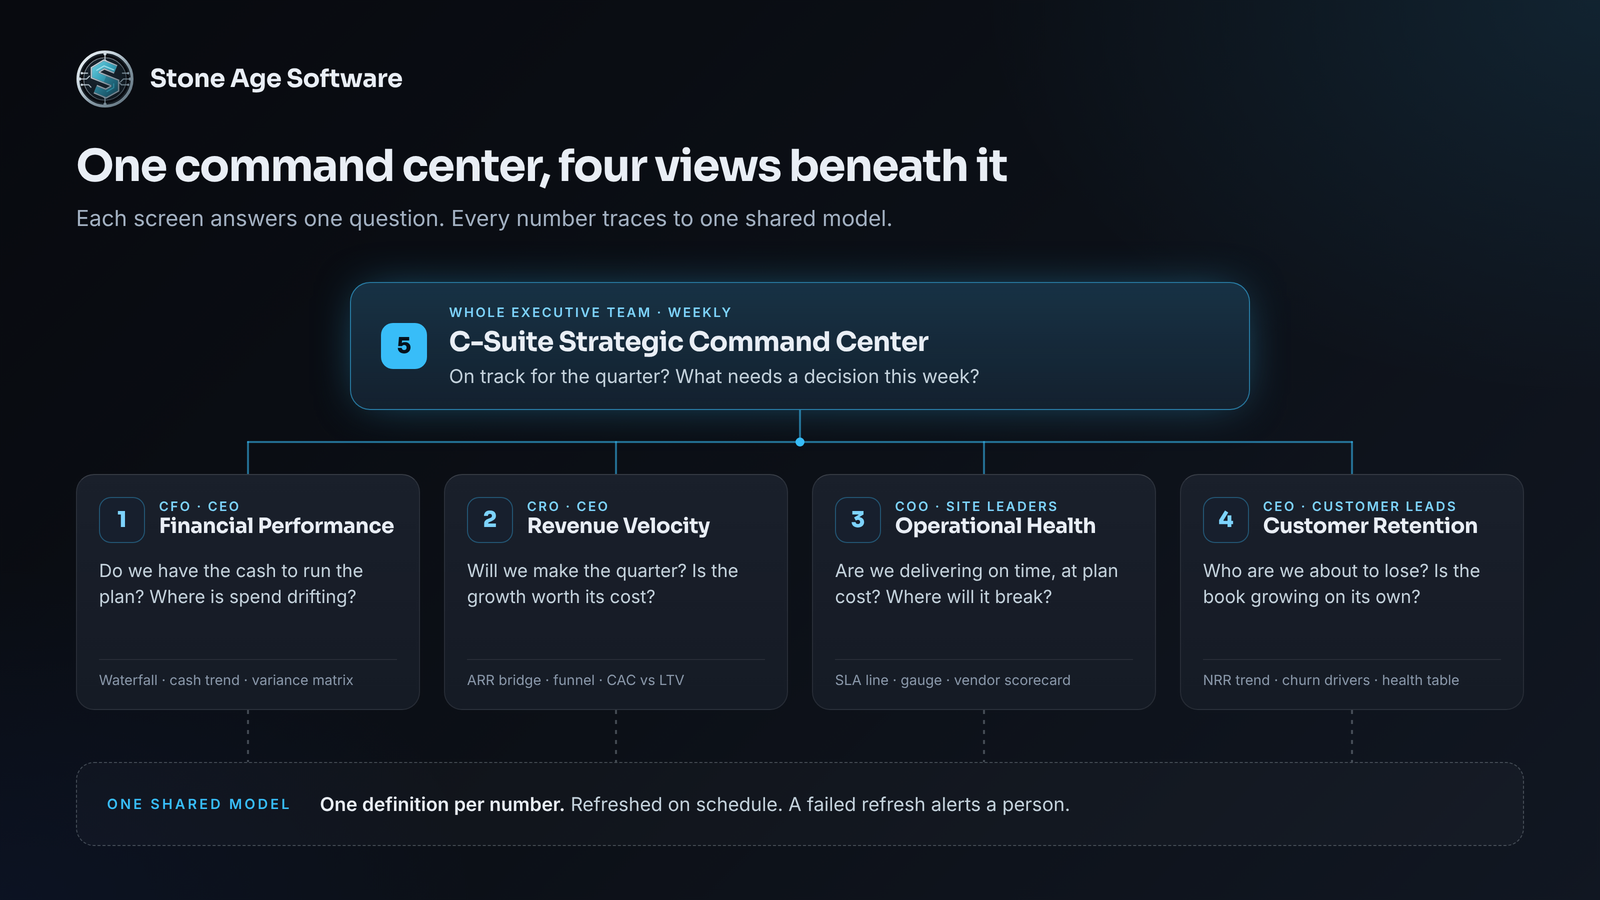
Read the stack from the top down. The command center asks whether the quarter is on track. The four domain views beneath it explain why. Build them from the bottom up, on one shared model, so every number on the top screen traces to exactly one place below it.
1. Executive Financial Performance Dashboard
For the CFO and CEO, opened before the Monday review.
Strategic mandate: Do we have the cash to run the plan, and where is spend drifting from it?
Core KPIs and visuals
- KPI visuals across the top for days of cash on hand, EBITDA margin, runway in months and working capital days. Each one shows a target and a trend line behind the number.
- Waterfall chart as an EBITDA bridge from plan to actual. Price, volume, labor and freight each show their push or pull.
- Line and clustered column chart for 13-week cash flow, actual against forecast.
- Matrix of OPEX and CAPEX variance by department, with conditional color and a sparkline on every row.
- Decomposition tree behind any variance, splitting it by department, cost center and vendor.
Layout
┌────────────────────────────────────┐
│ TOP BAR                            │
│ [Days cash] [EBITDA %]             │
│ [Runway] [WC days]                 │
├────────────┬───────────────────────┤
│ LEFT PANEL │ CENTER VISUALS        │
│ Entity     │ EBITDA bridge         │
│ Period     │ (waterfall)           │
│ Scenario   ├───────────────────────┤
│            │ 13-week cash vs       │
│            │ forecast (combo)      │
├────────────┴───────────────────────┤
│ BOTTOM BREAKDOWN                   │
│ OPEX/CAPEX variance by             │
│ department (matrix)                │
└────────────────────────────────────┘
Built out, the same layout looks like this:
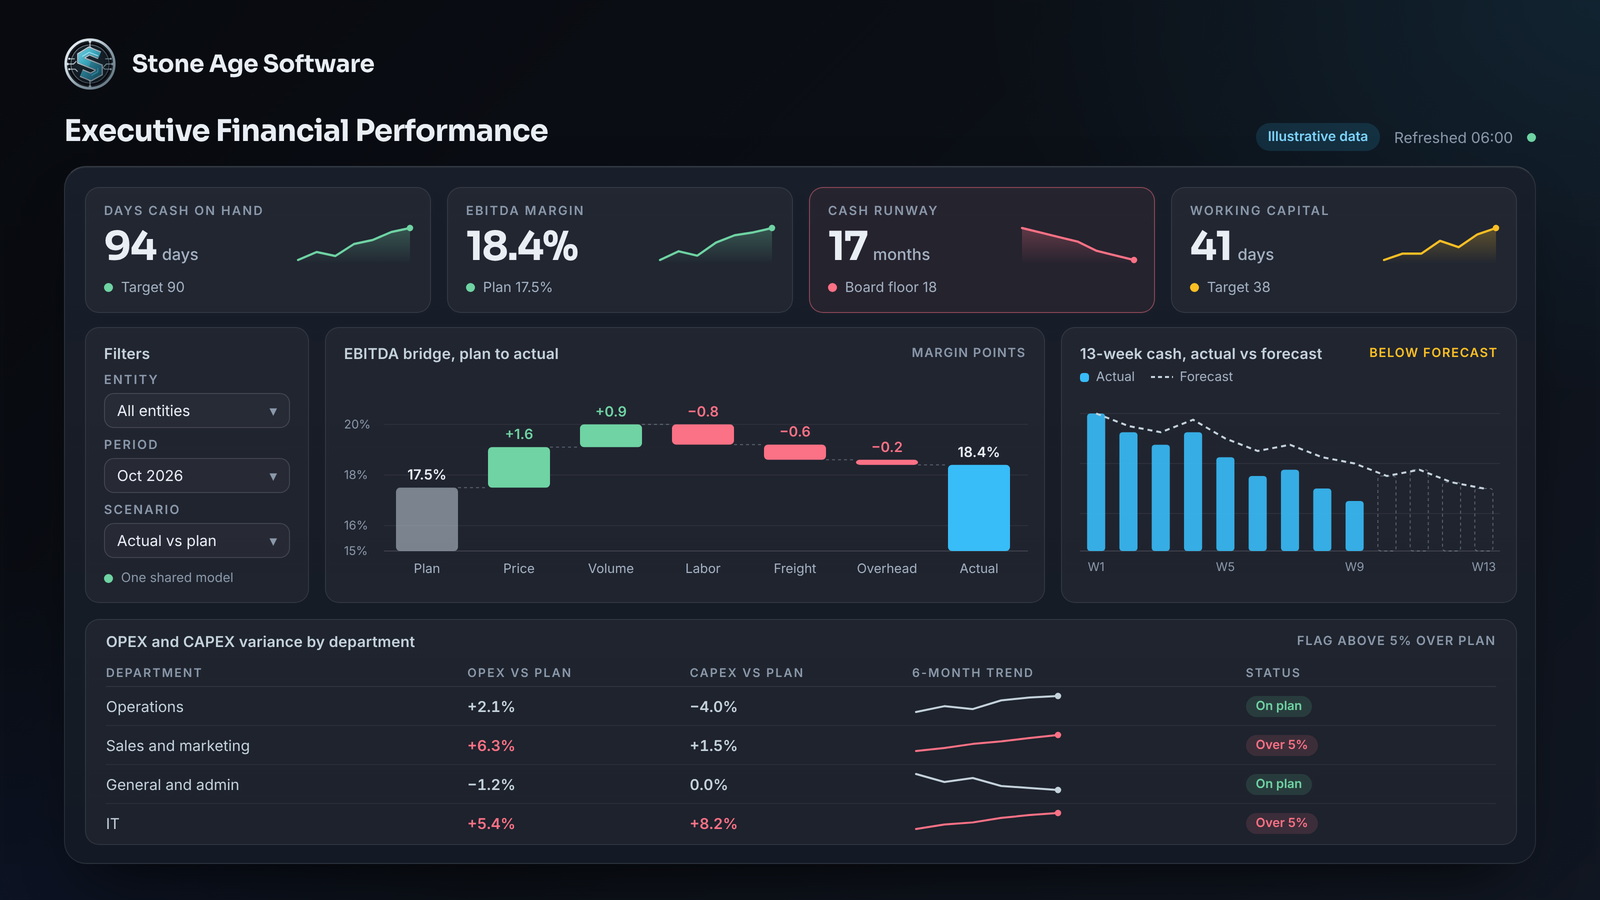
Executive action playbook: Runway dips under the board's 18-month floor while two departments run more than 5% over plan. The CFO pauses the next CAPEX release for those two departments. Both move to a weekly reforecast until they recover. The call happens in the Monday review, not at quarter close.
2. Revenue & Sales Velocity Dashboard
For the CRO and CEO, checked weekly and daily near quarter end.
Strategic mandate: Will we make the quarter, and is the growth we are buying worth what it costs?
Core KPIs and visuals
- KPI visuals for pipeline coverage against quota, win rate, sales cycle length and the LTV-to-CAC ratio.
- Waterfall chart as an ARR or MRR bridge: starting recurring revenue, plus new and expansion, minus contraction and churn. For contract businesses, read ARR as contracted recurring revenue.
- Funnel chart of pipeline by stage, with the conversion rate between stages.
- Scatter chart of CAC against LTV by segment, sized by deal count. Segments below a 3:1 ratio stand out at a glance.
- Clustered bar chart of win rate by segment and by competitor.
Layout
┌────────────────────────────────────┐
│ TOP BAR                            │
│ [Coverage] [Win rate]              │
│ [Cycle days] [LTV:CAC]             │
├────────────┬───────────────────────┤
│ LEFT PANEL │ CENTER VISUALS        │
│ Segment    │ ARR bridge (waterfall)│
│ Region     ├───────────────────────┤
│ Quarter    │ Pipeline by stage     │
│            │ (funnel)              │
│            ├───────────────────────┤
│            │ CAC vs LTV (scatter)  │
├────────────┴───────────────────────┤
│ BOTTOM BREAKDOWN                   │
│ Win rate by segment and            │
│ competitor (bar)                   │
└────────────────────────────────────┘
Executive action playbook: Next quarter's coverage falls below 3x in one segment while CAC in its main channel climbs. The CRO moves budget and rep time to the segment where LTV-to-CAC still clears 3:1. The shift happens in week three, while it can still change the number.
3. Operational Health & Supply Chain Dashboard
For the COO and site leaders, checked every morning.
Strategic mandate: Are we delivering what we promised, on time and at plan cost? Where is it about to break?
Core KPIs and visuals
- KPI visuals for order-to-ship time, on-time in-full (OTIF), labor and equipment utilization, and open defects or tickets.
- Line chart of fulfillment speed by day, with the service-level target drawn as a constant line.
- Matrix scoring each vendor and carrier on on-time rate, fill rate and lead-time drift, with icons for SLA breaches.
- Gauge for capacity use against plan. Microsoft's guidance says gauges suit current status against a goal, which is exactly this job.
- Decomposition tree for defects and tickets, by site, process and root cause.
This is the panel where a squeeze like September's shows up early, as stretched lead times and missed appointments. FreightWaves reported that transportation capacity contracted steeply that month too.
Layout
┌────────────────────────────────────┐
│ TOP BAR                            │
│ [Order-to-ship] [OTIF]             │
│ [Utilization] [Tickets]            │
├────────────┬───────────────────────┤
│ LEFT PANEL │ CENTER VISUALS        │
│ Site       │ Speed vs SLA (line)   │
│ Shift      ├───────────────────────┤
│ Customer   │ Capacity vs plan      │
│            │ (gauge)               │
├────────────┴───────────────────────┤
│ BOTTOM BREAKDOWN                   │
│ Vendor SLA scorecard (matrix)      │
│ Defects by cause (decomp tree)     │
└────────────────────────────────────┘
Executive action playbook: One vendor's on-time rate sits below SLA for two straight weeks. The decomposition tree traces most late orders to that vendor's lanes. The COO shifts volume to the backup vendor and asks for a recovery plan before customers feel it.
4. Customer Retention & Product Health Dashboard
For the CEO and customer leaders, reviewed weekly and before every renewal.
Strategic mandate: Which customers are we about to lose, and is the existing book growing on its own?
Core KPIs and visuals
- KPI visuals for net revenue retention (NRR), gross revenue retention and logo churn, each against target.
- Line chart of NRR by quarterly cohort, with 100% drawn as the line that matters.
- Table of accounts by health score, with red, amber and green icons, renewal date, open tickets and a usage sparkline.
- Key influencers visual showing which factors push an account toward churn, such as ticket volume, falling usage or late shipments.
- Scatter chart of health score against days to renewal, so weak accounts near renewal cluster in one corner.
For a service business, product health means service quality: order accuracy, claims and response time.
Layout
┌────────────────────────────────────┐
│ TOP BAR                            │
│ [NRR] [GRR] [Logo churn]           │
│ [Avg health score]                 │
├────────────┬───────────────────────┤
│ LEFT PANEL │ CENTER VISUALS        │
│ Segment    │ NRR by cohort (line)  │
│ Tier       ├───────────────────────┤
│ Owner      │ Churn drivers         │
│            │ (key influencers)     │
├────────────┴───────────────────────┤
│ BOTTOM BREAKDOWN                   │
│ Accounts by health, renewal        │
│ and usage (table)                  │
└────────────────────────────────────┘
Executive action playbook: Three top-20 accounts slip into the red band within 90 days of renewal. The CEO assigns each one an executive sponsor that week. Operations reviews service on all three before any renewal conversation starts.
5. C-Suite Strategic Command Center
For the whole executive team, run in the weekly meeting.
Strategic mandate: Are we on track for the quarter, and what needs a decision this week?
Core KPIs and visuals
- Power BI scorecard for OKRs, listing each objective, its key results, an owner and a status.
- KPI visuals in one row, a headline number per department, each against its quarterly target.
- Table of open risks sorted by severity, with owner, due date and the dashboard that raised it.
- Data alerts on the headline cards. Pin them to a dashboard, and Power BI syncs each alert to the notification center, the mobile apps and Teams.
- Buttons that jump to the four domain dashboards.
Alerts need tiers, or they turn into noise. On a consumables replenishment build, we used three. Critical and warning items send one email. Watch items stay on the screen.
Layout
┌────────────────────────────────────┐
│ TOP BAR                            │
│ [On track] [At risk]               │
│ [Off track] [Alerts]               │
├────────────┬───────────────────────┤
│ LEFT PANEL │ CENTER VISUALS        │
│ Quarter    │ OKR scorecard         │
│ Department │ (owner, status)       │
│            ├───────────────────────┤
│ Go to:     │ Quarterly targets     │
│ Finance    │ (KPI row)             │
│ Revenue    │                       │
│ Ops        │                       │
│ Customer   │                       │
├────────────┴───────────────────────┤
│ BOTTOM BREAKDOWN                   │
│ Risk register by severity          │
│ (table)                            │
└────────────────────────────────────┘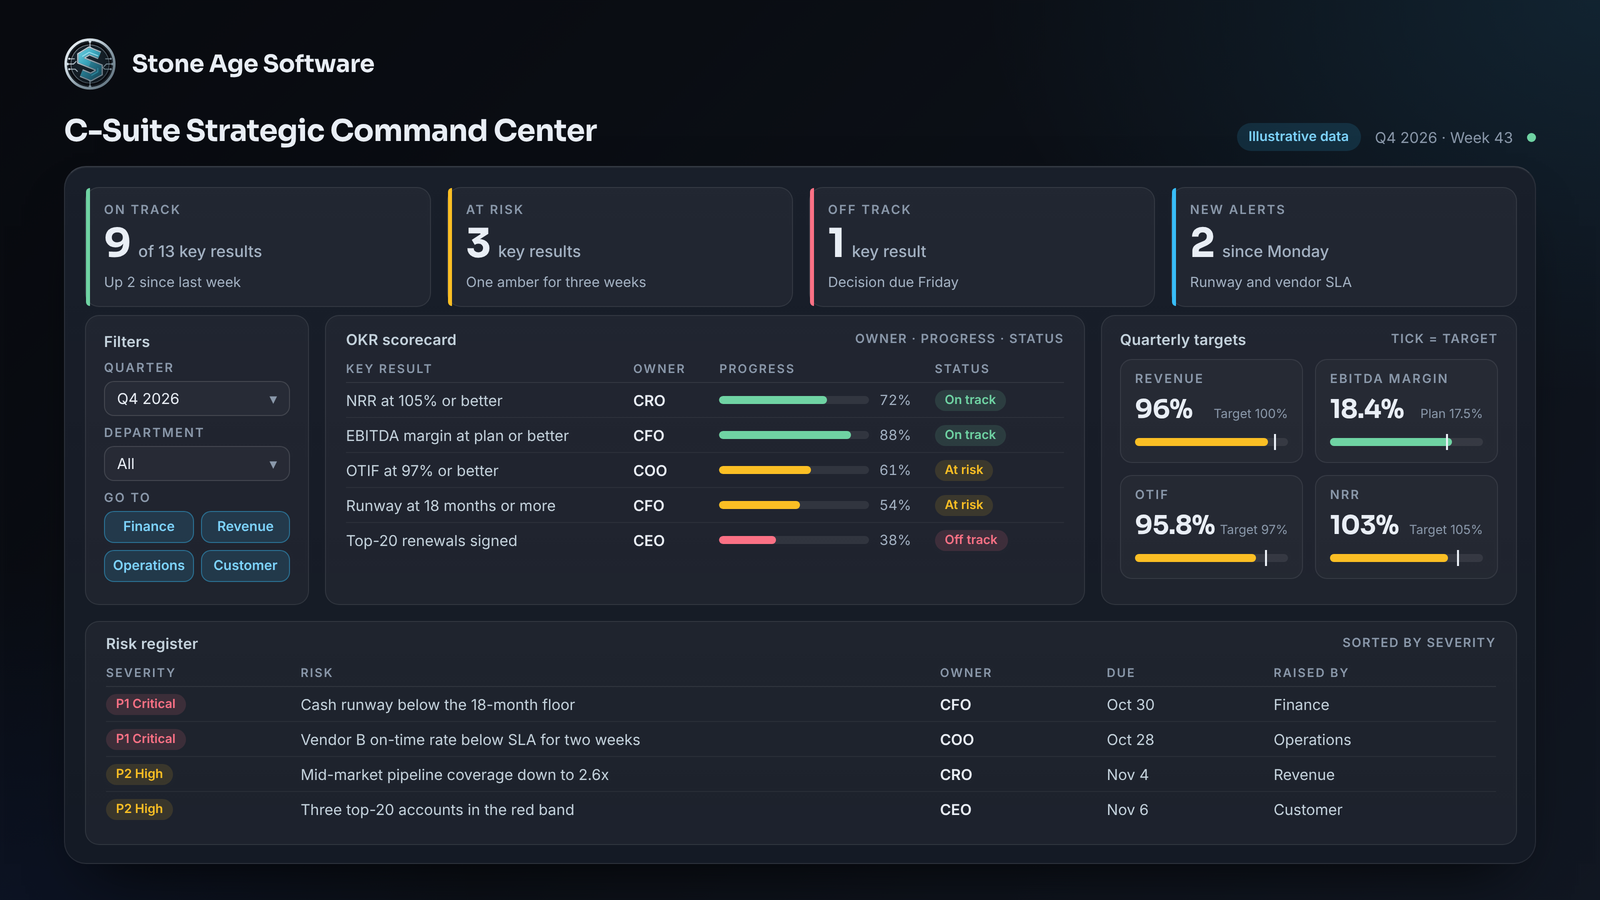
Executive action playbook: The weekly executive meeting works only the red rows. Every critical risk leaves the room with an owner, a decision and a date. A key result that stays amber for three weeks gets more resources or a reset target, on the record.
Three rules for Power BI dashboards executives open
1. The five-second rule. If the headline question takes longer than five seconds, cut until it does not. Microsoft's dashboard design guidance puts the highest-level number in the upper-left corner and keeps everything on one screen. 2. Progressive disclosure. Summary first, detail on request. A card leads to a page, and the page leads to a drill. Three layers is the ceiling. 3. Mobile and iPad optimization. Build the phone layout alongside the main canvas. Microsoft's mobile guidance puts the most important visuals first and lets only single-number visuals like cards and KPIs sit side by side. Then test on the tablet and phone your executives actually carry.
A visual architecture checklist for BI teams
Executives do not need more dashboards. They need five that agree. When the CFO, CRO and COO read the same revenue figure, the meeting shifts from arguing about numbers to deciding with them. None of this replaces the analyst. It frees them from rebuilding Monday's deck so they can chase the exceptions.
We saw that shift on a multi-year platform build for a contract-logistics operation. Forty small systems became one, and a screen now says when something breaks.
Open your current executive dashboard and check each line:
- Each page answers one question, and its title says which.
- The headline number sits top-left, with a target and a trend.
- Numbers are rounded to three or four digits.
- Every figure comes from one shared model, defined once.
- The refresh time shows on every page, and a failed refresh alerts a person.
- Detail sits no more than two clicks below the summary.
- A phone layout exists, and it loads fast.
- Each view names the decision it supports and the person who owns it.
If a line fails, you have found the next fix. Our Power BI and Power Platform team builds these five views on one shared model, documented and owned by more than one person. The work is a fixed price, quoted up front.