On 20 October 2026, a grid power disruption took one zone of Google Cloud's London region offline for six hours. The backup generators never started. Google's preliminary incident report says both the primary and backup PLC controllers failed to initiate the transfer. The UPS batteries drained, the zone went dark, and failover traffic then overloaded the two healthy zones. Banks and a parcel carrier felt it, as The Register reported that morning.
That chain is four causes deep, and every link is structural. Six Sigma for IT operations exists to dissect exactly that shape of failure. Not the ceremony, just the working parts: measure before you opine, prove the cause before you fix it, and build the control so the fix holds. Most service desks and CI/CD pipelines are short on all three.
Six Sigma for IT Operations Is Not the Bureaucracy You Remember
Six Sigma earned its reputation from the wrapper: belts, tollgate reviews and sixty-page charters. The method fits in four sentences. A defect is any outcome the customer would reject. Variation, not the average, is what customers feel. Causes are proven with data, not with seniority. Controls are built into the work so the gain outlives the project team.
Agile teams run short feedback loops, and cloud platforms emit more telemetry than anyone reads. What both lack is arithmetic. MTTR is reported as a mean, and its standard deviation never reaches a dashboard. Post-mortems stop at the first "why" because the second one points at a budget. Pipelines detect defects in staging when they could prevent them at commit. ASQ describes DMAIC as the frame for an existing process that fails to meet a standard. A ticket queue is that process; so is a deploy.
Keep the rigor. Drop the ceremony.
Case Study: Running DMAIC on the Service Desk
The scenario is a composite built from the shape IAM queues usually take; the numbers are realistic, not real. A 900-person company onboards 40 to 60 people a month. Every hire, transfer and contractor needs accounts, groups and application roles. Those requests arrive as Tier 2 "access" tickets, and that queue now throttles onboarding. Nobody can say what "fixed" looks like in numbers, and that is where DMAIC starts.
Define
Define turns a complaint into a measurable target. The team wrote three critical-to-quality (CTQ) requirements with the hiring managers who consume the service:
- Access is usable within 24 elapsed hours of an approved request (the SLA).
- The requester hears back within one business hour.
- The access granted matches the request the first time, with no reopen.
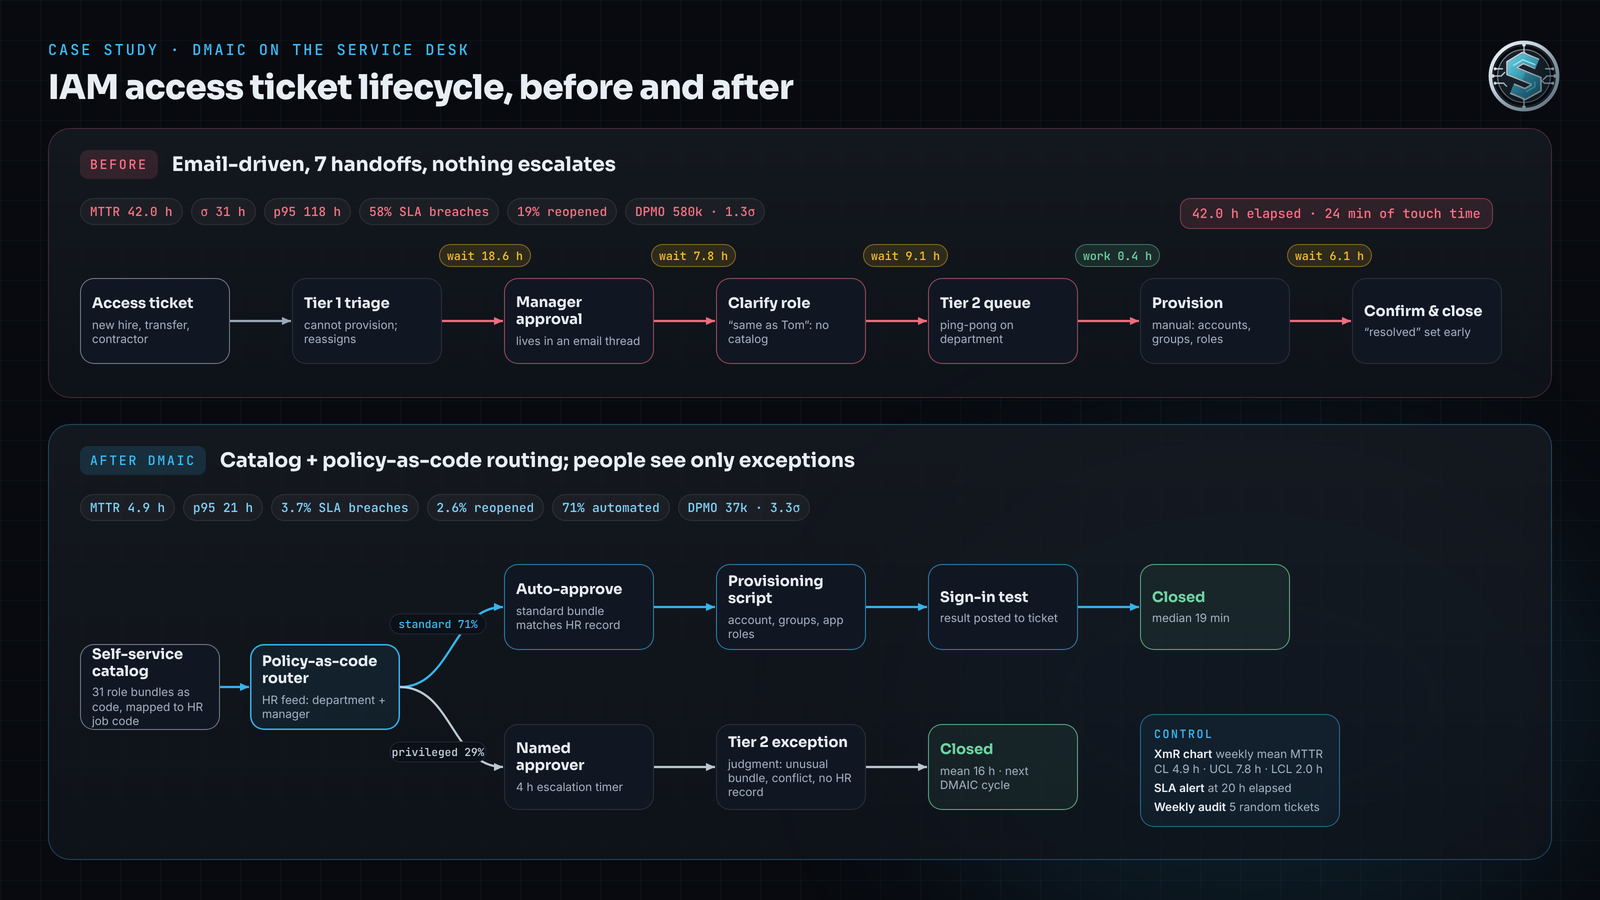
The baseline came from the last full quarter: 1,240 access tickets. Mean time to resolution (MTTR) was 42.0 hours, with a standard deviation of 31 hours, so the mean described almost nobody. The 95th percentile was 118 hours. Fifty-eight percent breached the 24-hour SLA, and 19 percent were reopened because the wrong role was granted.
A defect was any ticket that breached the SLA or was reopened. That gave 580,000 defects per million opportunities (DPMO), roughly a 1.3 sigma process. The one-sided capability index against the 24-hour limit was negative: the mean itself sat outside the specification. The one-page charter: DPMO below 50,000 and p95 below 24 hours within a quarter, no added headcount.
Measure
Measure maps the process as it actually runs, not as the runbook describes it. The team walked twelve tickets end to end and timestamped every handoff:
- 18.6 hours waiting for a manager approval that lived in an email thread
- 9.1 hours waiting in the Tier 1 to Tier 2 reassignment queue
- 7.8 hours waiting for the requester to clarify which role they meant
- 6.1 hours waiting for the requester to confirm the access worked
- 0.4 hours of actual provisioning work
Touch time was 24 minutes inside a 42-hour cycle, a process cycle efficiency under one percent. The measurement system itself got checked, because ticket timestamps lie. "Resolved" was set when the engineer finished, not when the user could sign in. Correcting that added 4 hours to the true baseline.
Analyze
Analyze asks which few causes drive most of the pain. A Pareto of breach-hours put 81 percent of the delay on three:
- Approvals with no owner and no clock. The approval went to a manager's inbox, where nothing escalated it and nothing could tell whether it had been read. This one seam held 44 percent of all waiting.
- No role catalog. "Give Priya the same access as Tom" was a valid request, and the only definition of Tom's access was Tom's account. Requests bounced for clarification 22 percent of the time. Internal platforms carry the same gap when a permission is a bit column on the user table and nothing records which screens a role opens.
- Tier 1 to Tier 2 ping-pong. Tier 1 could not provision, so every access ticket was a reassignment. Tier 2 could not see the requester's department, so a third of tickets went back with a question.
None of these is a people problem. Each is a place where the ticket system, the directory and the HR system did not talk, and a person was standing in the gap.
Improve
Improve changes the process first and automates second. Three changes landed in a six-week pilot:
- A role catalog with 31 standard bundles, each defined as code and mapped to an HR job code, so "Warehouse Supervisor, Site 3" replaces describing what Tom has.
- Policy-as-code approval routing. A standard bundle matching the requester's department and manager in the HR feed is approved automatically. A privileged bundle routes to a named approver with a four-hour escalation timer. The approver's decision sets the ticket status, the same pattern as a request queue where the approvals set the status.
- Provisioning scripts that create the account, groups and application roles from the bundle definition, then post the sign-in test result back to the ticket.
Tier 2 engineers now see only exceptions: unusual bundles, conflicts of interest, contractors with no HR record. That is where their judgment was always needed; the software took the retyping, not the decisions.
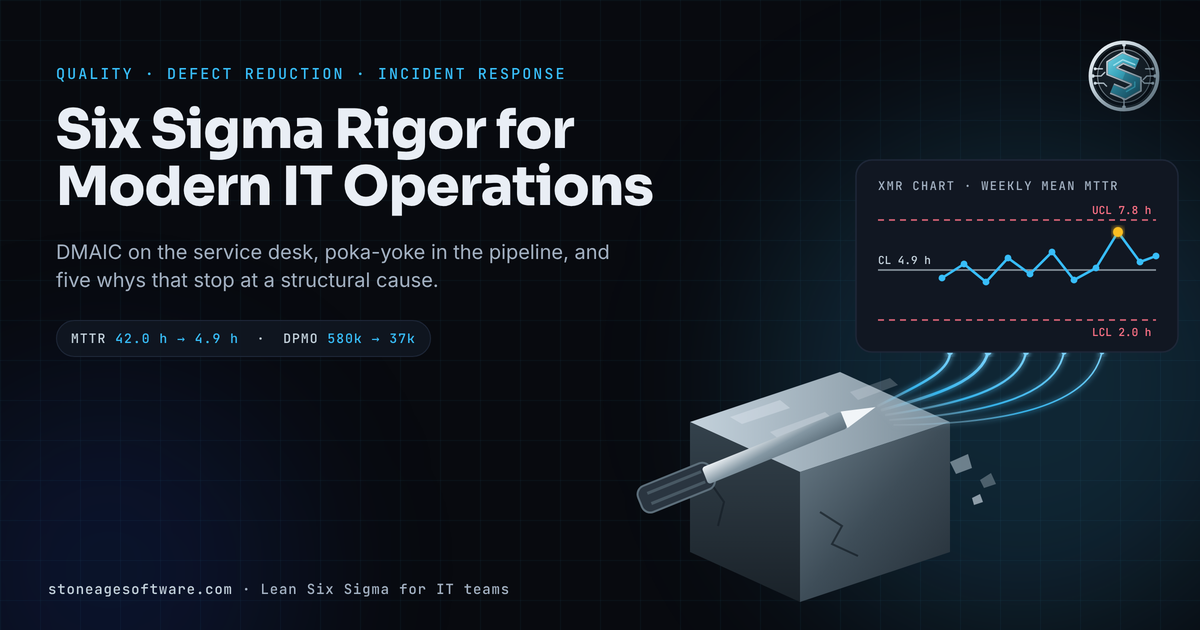
First full quarter after the change: 71 percent of requests were fulfilled automatically, with a median of 19 minutes. MTTR across all tickets fell to 4.9 hours and p95 to 21 hours. SLA breaches dropped to 3.7 percent and reopens to 2.6 percent. DPMO landed at 37,000, roughly 3.3 sigma.
One honest footnote: capability indices assume one process, and there are now two. The automated path sits far inside the limit, with a Cpk above 2. The exception path runs a 16-hour mean, a 7-hour standard deviation and a Cpk of 0.38. That is where the next DMAIC cycle starts.
Control
Control makes the gain permanent through three mechanisms:
- An XmR control chart on weekly mean MTTR. With a center line of 4.9 hours and an average moving range of 1.1 hours, the limits sit at 2.0 and 7.8 hours, per the individuals-chart formula in the NIST/SEMATECH e-Handbook. A week above 7.8 hours is a signal, not an opinion.
- An automated SLA breach alert that fires at 20 hours elapsed, four hours before the breach, and pages the exception owner.
- A weekly 15-minute control audit: five random tickets checked against the bundle definition and the HR record, logged on the chart.
Key takeaway: DMAIC did not make the team faster. It removed the three seams where tickets waited and left a chart that shows drift early. That is how a chaotic queue becomes a low-variance delivery engine.
Poka-Yoke in the CI/CD Pipeline
Poka-yoke is the manufacturing term for mistake-proofing: a jig that only accepts the part the right way round. ASQ states the Control-phase goal plainly: make errors impossible or immediately detectable. The CI/CD translation: move the check to the earliest point where the mistake can exist, and let the pipeline refuse it there. A defect caught at commit costs minutes; caught in production, it costs a post-mortem.
1. Pre-commit secret detection and static analysis. A credential that enters git history is a defect you cannot fully delete; you can only rotate it and rewrite history. So the gate sits before the commit exists. Gitleaks or TruffleHog runs as a pre-commit hook and refuses the commit locally. Server-side push protection is the second net for the laptop that skipped the hook. Static analysis rides the same hook: linters and type checks fail in two seconds, not after a 14-minute CI run.
2. Schema migrations validated by dry run, with a tested rollback. Every migration runs three times against a disposable copy of the production schema before it can merge: up, down, and up again. The job fails on a destructive operation, on a down migration that does not restore the previous shape, or on a lock estimate over five seconds on any table past ten million rows. The lock check earns its keep by refusing the 40-million-row rewrite scheduled for 09:00 on a warehouse floor. With no working down path, a migration cannot merge, so rollback is never decided at 03:00.
3. Canary analysis with automatic rollback. The new version takes five percent of traffic for ten minutes beside the old one. A Prometheus alerting rule compares the canary's error rate and p95 latency against the baseline cohort. If errors rise more than 0.5 percentage points, or p95 exceeds 1.3 times baseline, the deploy reverses itself. A Datadog anomaly monitor does the same job on that stack. The rule is the gate; nobody sits in a room approving the number.
The same principle holds where no canary is possible. On an internal platform a warehouse floor cannot stop using, our release script records the running process ids, lays down the new files, then watches for a new process id across ten checks two seconds apart. If no new process appears, the job fails on purpose and leaves the old process serving. A 20-second proof window replaced "we pushed a fix" as the definition of done.
| Gate | Phase | Prevents or detects | Defect class blocked | |---|---|---|---| | Pre-commit secret scan | Commit | Prevents | Credential in history | | Static analysis and type check | Commit | Prevents | Syntax, type and lint defects | | Migration up, down, up on a snapshot | Build | Prevents | Untested rollback, long locks | | Dependency and SBOM audit | Build | Detects | Known vulnerable packages | | Canary analysis with auto-rollback | Deploy | Detects, then reverses | Latency and error regressions | | Startup proof before cutover | Deploy | Prevents | Dead process after release |
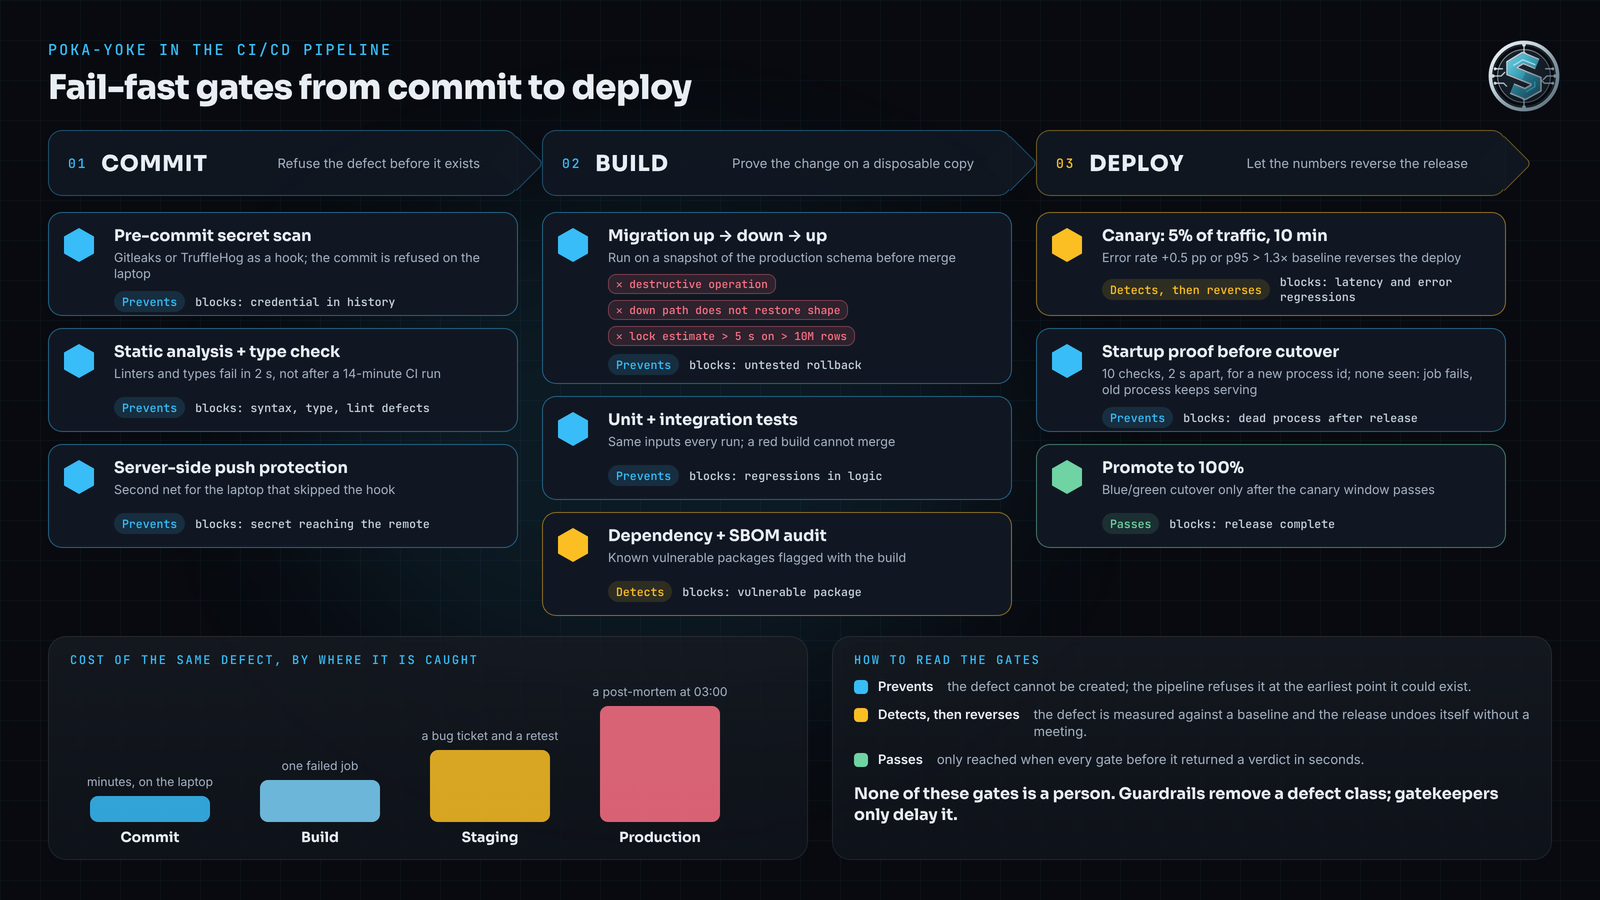
Key takeaway: None of these gates is a person. Each is a computed check that returns in seconds, so developers get a verdict, not a meeting. Guardrails remove a defect class; gatekeepers only delay it.
The 5 Whys of Post-Mortems: Blameless, Not Vague
There is a tension between blameless post-mortem culture and Six Sigma discipline. The Google SRE book defines a blameless post-mortem as one that assumes everyone acted in good faith with the information they had. True, and it is where many post-mortems stop: "blameless" becomes "causeless", with action items but no proven root cause.
Six Sigma resolves the tension with one rule: blame lands on structure, not on people, and the structure gets named precisely. The engineer is never the root cause. The missing budget, the archived board or the alert that watched the wrong number is. NIST SP 800-61 Rev. 3 frames incident response as part of risk management, with the stated goal of reducing the number and impact of incidents. You cannot reduce what you have not traced.
A worked 5 Whys
The incident is a composite drawn from real connection exhaustion events. At 03:12 UTC, the order API began returning 14 percent HTTP 5xx errors in two regions, for 41 minutes.
- Why did the API fail? The primary PostgreSQL instance refused new connections. Its limit of 500 was fully used.
- Why were 500 connections used? Forty-eight service pods each held a pool of 20, a potential 960 connections, after the autoscaler doubled the pods for a traffic spike.
- Why did scaling exceed the database's limit? No shared connection budget existed. The pool size lived in each service's config, and the limit lived in a database parameter. Nothing linked the two.
- Why was there no pooling layer? PgBouncer had been removed during the Q2 migration to a managed database, after a prepared-statement incompatibility. A ticket to reinstate it had no owner.
- Why did the ticket have no owner? Follow-ups were tracked on the migration board, and the board was archived when the migration was marked complete. "Complete" had no exit criteria.
The second region failed for a related reason: its read replicas had been routed to the primary after a replica-lag alarm, so both regions drew on one exhausted pool. The root cause is a missing shared budget and a close-out with no exit criteria. Nobody did anything wrong.
The fishbone, customized for IT
An Ishikawa diagram organizes contributing causes so the team can see where they intersect. Five categories cover infrastructure work:
- Code: pool size hardcoded per pod; reconnect logic with no backoff or jitter, so recovery became a connection storm.
- Architecture: connection count scaled linearly with replicas; no pooler between services and the database; cross-region failover converged on a single primary.
- Human/Process: migration close-out had no exit criteria; the change review template had no line for scaling limits; the runbook assumed the pooler still existed.
- Tooling/Environment: the autoscaler knew nothing of database limits; staging ran four pods and never reached the limit; the managed database default was never revisited.
- Metrics/Telemetry: the dashboard showed connection count, not percentage of maximum; no alert existed below 100 percent; the 5xx alert fired nine minutes after saturation began.
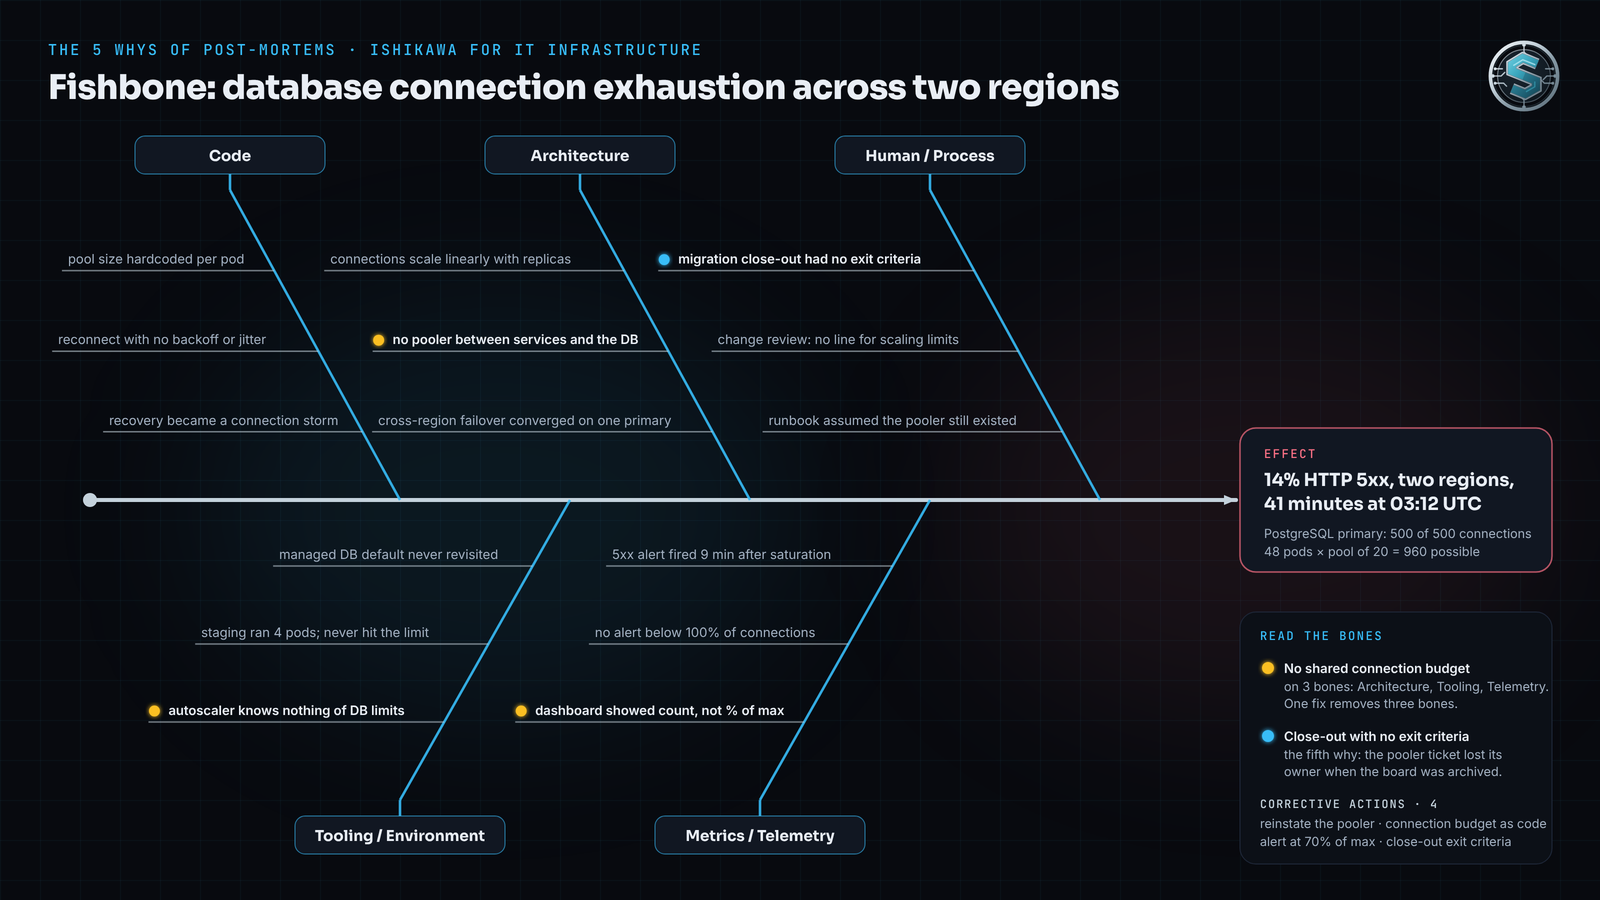
Interpretation is the step most teams skip: count how many categories each cause touches. "No shared connection budget" appears under Architecture, Tooling and Telemetry, so fixing it removes three bones at once. Rank corrective actions by bones removed, weighted by the cost of recurrence. Here that produced four: reinstate the pooler, express the connection budget as code the autoscaler reads, alert at 70 percent of maximum, and give migration close-outs exit criteria. That telemetry lesson is the one behind a platform dashboard that shows p95 beside the median: the median hides exactly the spike that pages you.
A reusable post-mortem template
Copy this into your incident repository. Every field is required; the control section is what makes it Six Sigma rather than a diary entry.
# Post-Mortem: <incident id> <one-line title>

**Severity:** SEV-<n>   **Status:** Draft | Reviewed | Closed
**Owner:** <role, not name>   **Review date:** <yyyy-mm-dd>

## 1. CTQ impact
- CTQ affected: <e.g. order API availability, 99.9 percent monthly>
- Customer-visible effect: <what users saw>
- Duration: <start UTC> to <end UTC> (<minutes>)
- Defect count: <failed requests, failed jobs, affected users>

## 2. Timeline (UTC)
| Time | Event | Source (alert, person, log) |
|---|---|---|
| | | |

## 3. Detection
- Time to detect: <minutes from first defect to first alert>
- Detected by: <alert name | customer | staff>
- Why detection took this long: <structural reason>

## 4. 5 Whys
| Why | Answer | Evidence |
|---|---|---|
| 1 | | |
| 2 | | |
| 3 | | |
| 4 | | |
| 5 | | |

## 5. Fishbone summary
- Code:
- Architecture:
- Human/Process:
- Tooling/Environment:
- Metrics/Telemetry:
- Causes appearing in 2+ categories: <these are your root causes>

## 6. Corrective actions
| Action | Bones removed | Owner (role) | Due | Verification |
|---|---|---|---|---|
| | | | | |

## 7. Control
- Chart or alert that proves the fix holds: <name, threshold>
- Review cadence: <weekly | per release>
- Exit criteria to close this post-mortem: <measurable>

## 8. What went well
- <two items maximum, both structural>
How the Three Pillars Compound
Each pillar attacks a different defect population, so the gains multiply rather than add. DMAIC cuts variance in the work that reaches people. Poka-yoke cuts the defects that reach production. Rigorous post-mortems turn the defects that still escape into structural fixes, so the same class never returns.
Run the composite above through two quarters of this. Change failure rate falls from 11.3 percent to 2.4 percent. No incident repeats an earlier root cause. On-call pages drop from 31 a month to 6. Engineers who are not re-fighting last month's outage at 03:00 stay, which protects morale better than any pizza budget.
The 30-Day Six Sigma Service Audit for IT Teams
## Week 1: Define and Measure
- [ ] Pick one queue (access, deploys, incidents); write its CTQs with the people who consume it
- [ ] Pull 90 days of tickets; compute mean, standard deviation, p95 and SLA breach rate
- [ ] Compute DPMO and sigma level; post them where the team can see them
- [ ] Walk 10 tickets end to end; record elapsed time per handoff
- [ ] Check the measurement system: does "resolved" mean the user can work?

## Week 2: Analyze
- [ ] Build a Pareto of waiting hours by cause; name the top three seams
- [ ] For each seam, name the systems that fail to talk (not the people in between)
- [ ] Run a 5 Whys on the last SEV-1; stop only at a structural cause
- [ ] Draw the fishbone; mark causes that appear in two or more categories

## Week 3: Improve and mistake-proof
- [ ] Automate the top seam only; pilot on a subset for two weeks
- [ ] Add a pre-commit secret scan and a static check to every active repo
- [ ] Add up, down, up migration validation to the build
- [ ] Define canary thresholds and wire automatic rollback to them

## Week 4: Control
- [ ] Start an XmR chart on the weekly CTQ; compute limits from the first 20 points
- [ ] Set an alert ahead of the SLA, not at it
- [ ] Schedule a 15-minute weekly control audit with a named owner
- [ ] Adopt the post-mortem template; require a control section to close one
A check to run this afternoon: export your last 90 days of access tickets, deploys or incidents. Compute the mean and standard deviation of resolution time. If the standard deviation exceeds the mean, the process is not predictable, and no staffing change will make it so. The variance comes from a seam between systems, and DMAIC will find it in about two weeks.
That is the work behind our Lean Six Sigma consulting: DMAIC without the ceremony, a measured baseline before any code, and a control plan that outlives the project. For identity, endpoints and tickets, our managed IT services team runs the same method. Scope is fixed price, quoted up front.