Watch one picker work one order, start to finish. Count the seconds spent reaching for product. Then count the seconds spent walking. In most manual buildings, the walk wins by a wide margin.
That gap is what warehouse slotting optimization is for. Put the items you pick most often closest to where orders get packed. Every line gets a shorter trip. Every shift gets more lines out of the same hours.
The idea is old and simple. The hard part is knowing, with data, which items belong up front this month. That is the part we help warehouses answer.
Why warehouse slotting optimization matters more this peak
On October 15, the National Retail Federation forecast holiday sales growth of 4.2% for November and December. Last year's growth was 3.1%. The same release projects 325,000 to 375,000 seasonal hires. That range brackets last year's estimate.
Other numbers point the same way. Retail Dive reports that Challenger, Gray & Christmas expects seasonal retail hiring to fall 2.5% this year. And the Bureau of Labor Statistics shows warehousing and storage employment edging down from June through September, in preliminary figures.
Put those together. More orders are coming. More hands are not. The capacity has to come from somewhere. For most buildings, walking is the largest untapped pool of it.
How travel time eats the pick
The research here is not new. A widely cited review of order picking research estimates picking at up to 55% of warehouse operating expense. It also finds that travel is often the largest part of a picker's time. The breakdown it reproduces puts travel at roughly half.
Travel adds no value. No customer pays for the walk. Yet it is the one part of picking that layout controls directly.
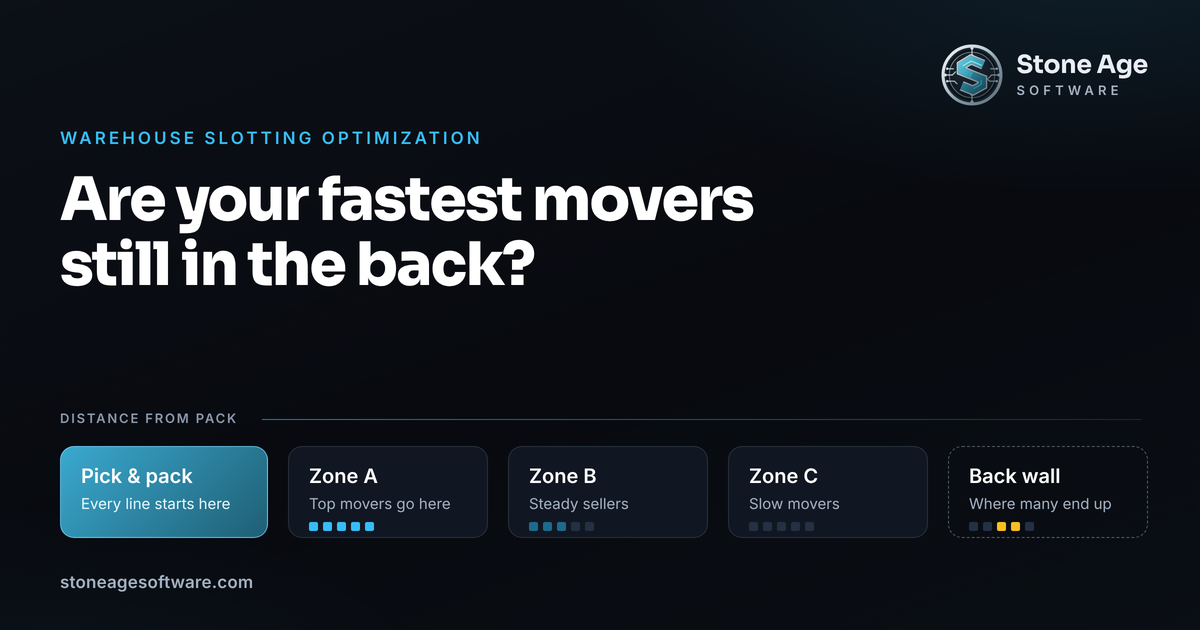
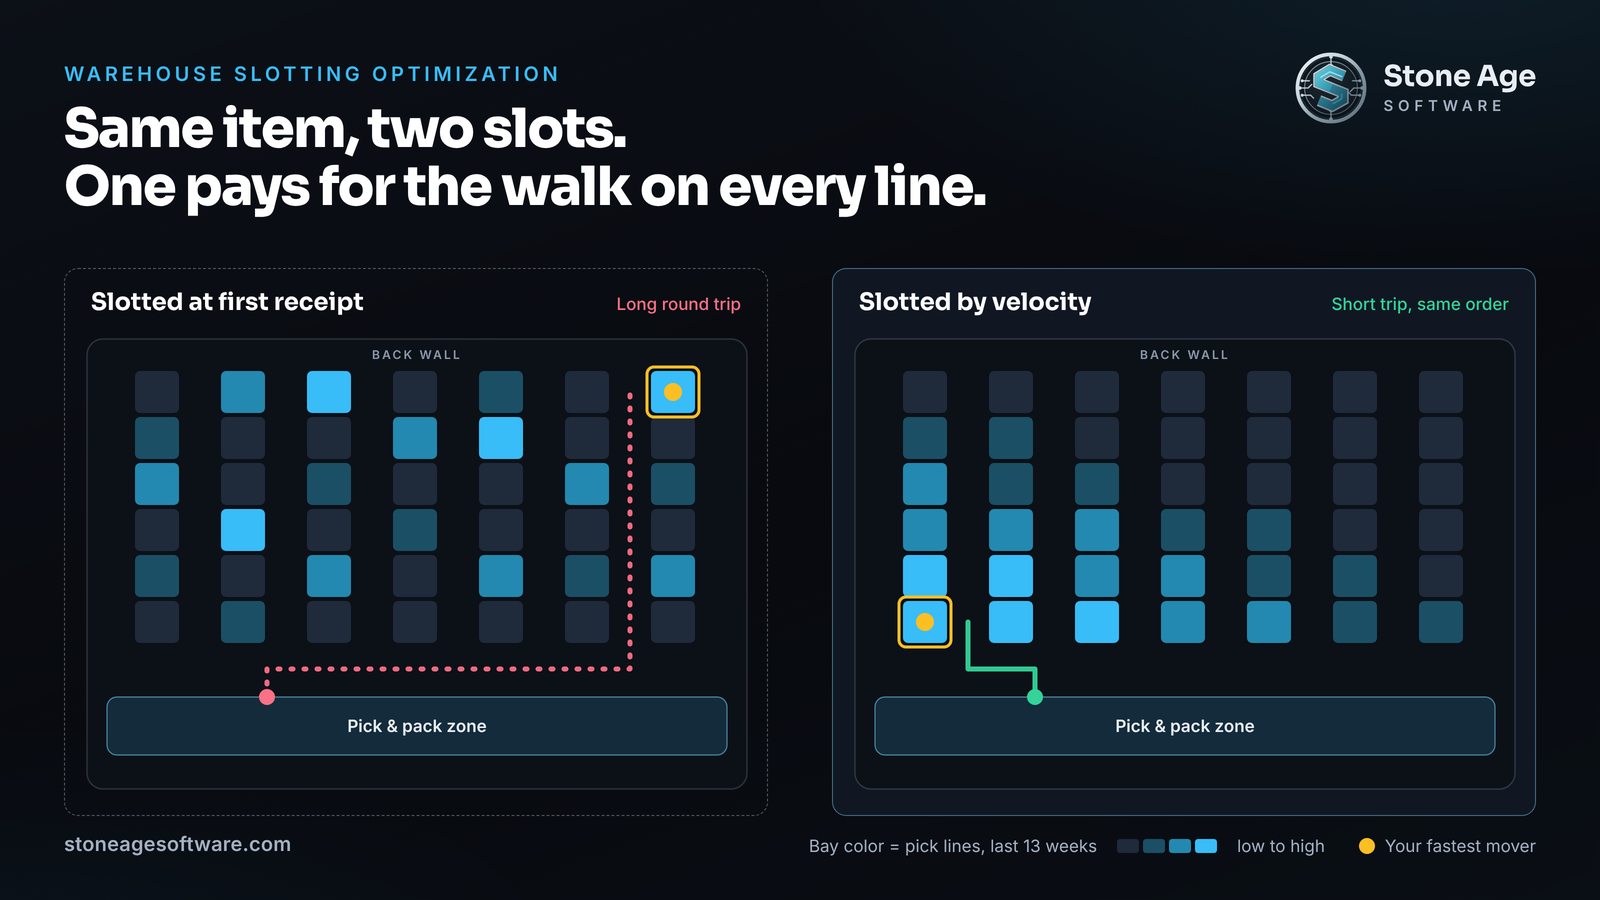
Here is how it adds up. Picture your top 50 items. If they sit in the back third of the building, every line for them pays a long round trip. Move them near the pack station and those same lines get short trips. Nothing else changes. Same people, same scanners, same orders.
This approach has a long history. The cube-per-order index, published by Heskett in 1963, compares the space an item needs with how often it is picked. Small, frequently picked items go closest. Bulky, rarely picked items go farther out. Most slotting logic in use today is a variation on that rule.
Why fast movers end up in the back
If the idea is this simple, why are so many buildings slotted backwards? The cause is structural. It is not a people problem.
- Slots get assigned at first receipt. A new item goes wherever a location is open that day. That spot sticks long after demand changes.
- Velocity drifts. A seasonal item spikes. A client launches a new line. An old bestseller fades. The rack does not move with any of them.
- The data sits in separate places. The warehouse system records every pick and every location. But standard reports rarely join the two with distance to pack.
- Re-slotting competes with the floor. Moving product takes labor on the same shifts that need it for orders. Without a ranked list, nobody can say which moves are worth it.
In a 3PL, all of this compounds. Each client's mix shifts on its own calendar. One client's peak arrives in October, another's in March. A slot plan built for last year's client list can be wrong for this year's in a dozen places at once.
None of this means anybody slotted the building badly. Each slot made sense the day it was assigned. The trouble is that nothing tells you when it stopped making sense.
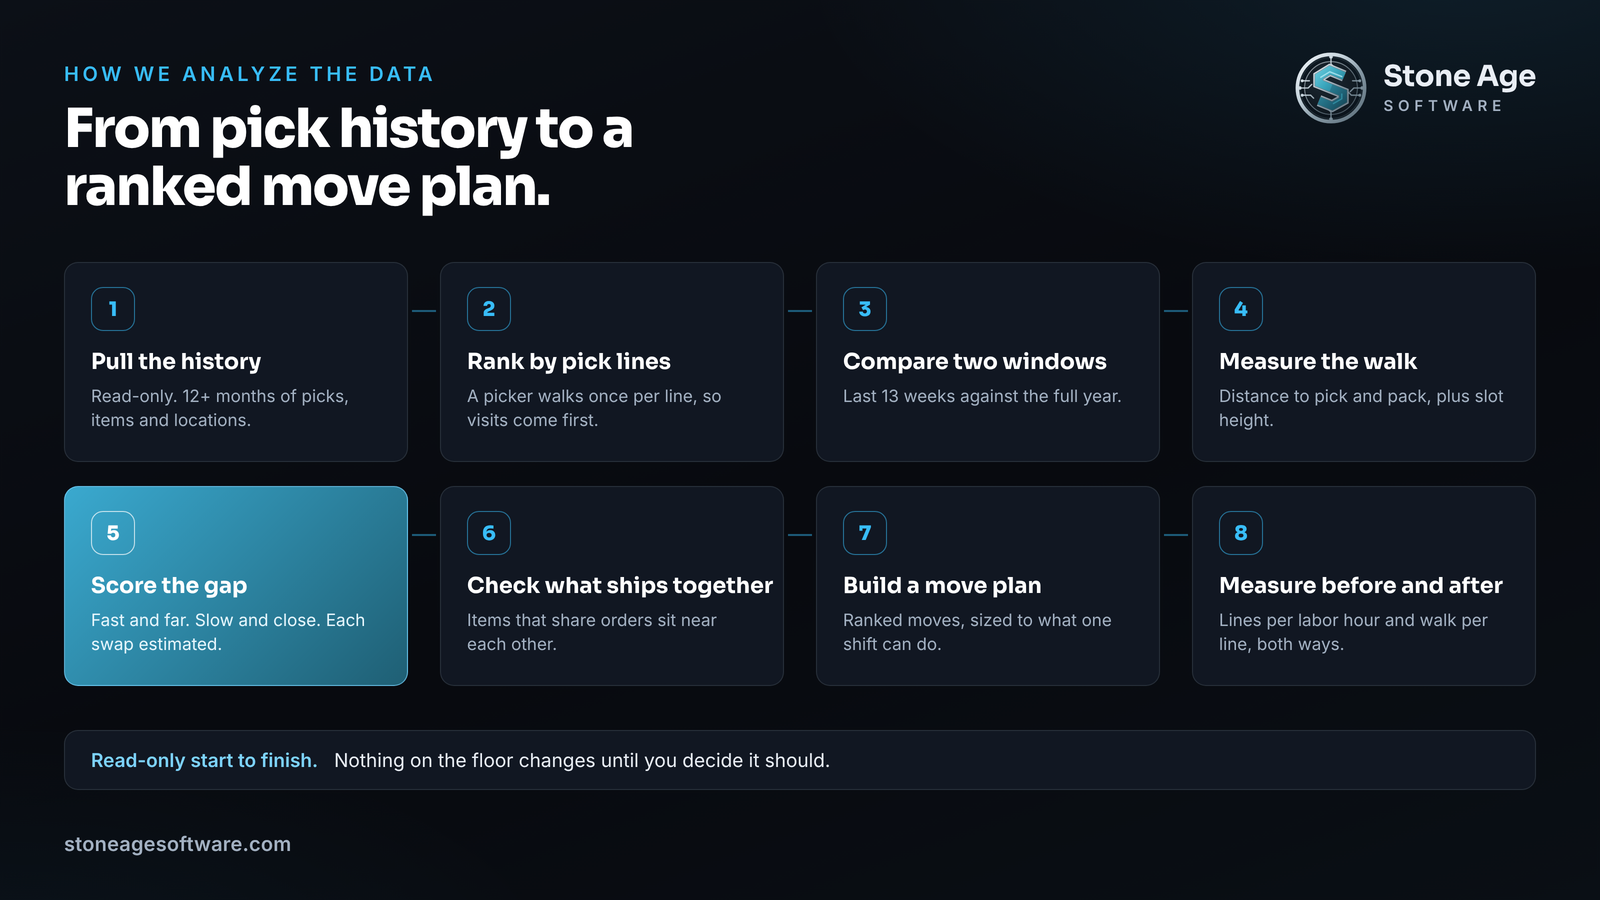
How we analyze the data
This is the part we do for warehouses. We work read-only from your existing system, the same way our 3PL reporting layer does. Nothing on the floor changes until you decide it should.
Here is the sequence.
- Pull the history. We extract at least 12 months of pick transactions, the item master with case dimensions, and the location master. A read-only account or a scheduled export is enough.
- Rank by pick lines, not units. A picker walks once per line, whether the line is one each or twelve. So we rank items by how often they are visited. Units come second.
- Compare two windows. We set the last 13 weeks against the full year. That separates true fast movers from a one-time spike. It also shows which items surge at peak.
- Measure the walk. Each location gets a travel distance from the pick and pack zone. Height counts too. A waist-level slot picks faster than one at the floor or overhead.
- Score the gap. We line up velocity against distance. Fast movers in far slots and slow movers in prime slots are the mismatch. Each possible swap gets an estimated cut in walking.
- Check what ships together. Items that often share an order should sit near each other. That shortens the walk within an order, not just the trip to the first item.
- Build a move plan. You get a ranked list of moves, sized to what your team can handle in a shift. The highest-value swaps go first.
- Measure before and after. We record lines per labor hour and walk distance per line before any move. Then we take the same numbers again afterward. Anything that got worse is reported too.
We have built against customer-owned warehouse platforms before. Our wave planning and pick execution project turned a flat order backlog into a pick queue the floor could run. The client owned neither system underneath. Slotting analysis draws on the same kind of data: orders, locations, on-hand stock, and status.
What comes back is plain. You get a floor heat map colored by pick lines, so the mismatch is visible at a glance. You get the gap list behind it, item by item, with the reasoning for each move. And you get the queries and definitions, so anyone on your team can check the math.
The work stays useful after the first pass. The analysis can refresh on a schedule. When velocity drifts, the gap report shows it before pickers feel it.
What a good slotting plan respects
The shortest trip is the goal. It is not the only rule. A plan that ignores the floor will not survive a week.
- Ergonomics. Heavy items belong at waist height, even if a lighter item picks more often.
- Congestion. Packing every top item into one aisle creates a traffic jam. Spread the hottest items across a few nearby faces.
- Replenishment. A fast mover in a small slot needs constant refills. Size the slot to hold a day or more of demand where you can.
- Product rules. Hazmat, temperature, lot control, and client segregation come first. Velocity works inside those limits.
- Move cost. A swap that saves a few steps a day is not worth a shift of moves. Rank by return, not by score alone.
This is where your people earn their keep. The data proposes. Your supervisors know which aisle jams at two in the afternoon. They know which client audits shelf labels and which forklift lane cannot take more traffic. The software frees them from building the list by hand, so their time goes to those calls instead.
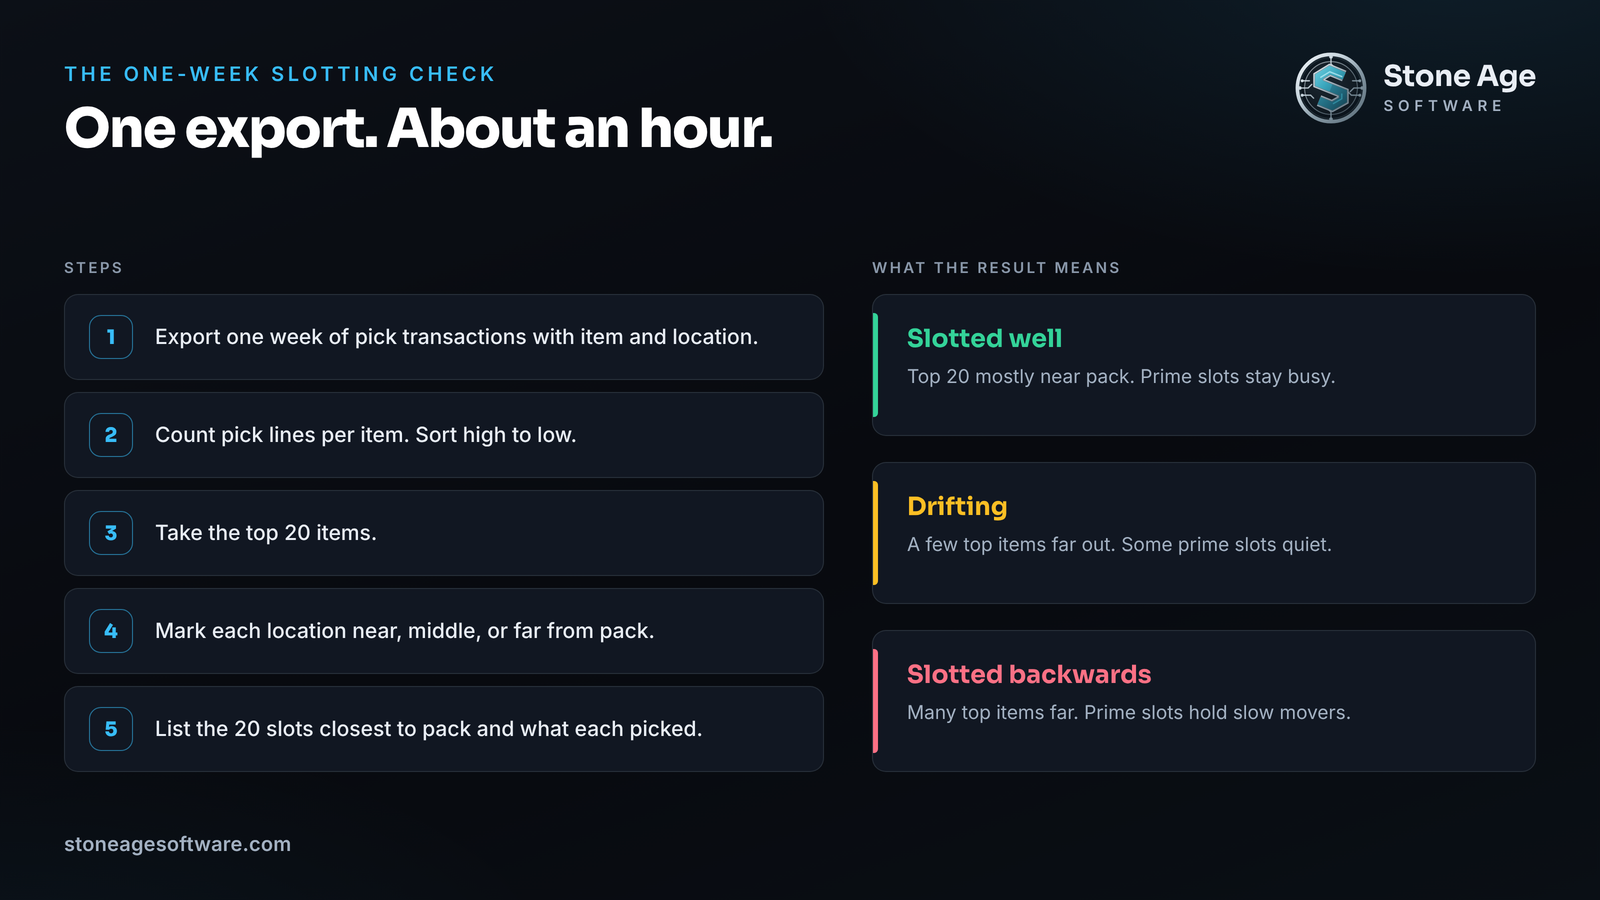
Run the one-week slotting check
You can test your own building before calling anybody. It takes one report export and about an hour.
- Export one week of pick transactions with item and location.
- Count pick lines per item and sort from high to low.
- Take the top 20 items.
- Mark each one's location as near, middle, or far from pack.
- Now list the 20 locations closest to pack. Note what sits in each and how many lines it picked that week.
If more than a handful of your top 20 sit in far locations, you have a slotting gap. The same is true if prime slots hold items that barely picked. Either way, the gap probably grew one sensible decision at a time.
If you want the full picture, that is what our 3PL reporting layer is built for. We read from the system you already run, build the velocity and gap analysis, and hand you a ranked move plan. The work is fixed price, quoted up front.