A single order came off the printer at 6:40 on a Tuesday. One SKU, two units, a residential address, nothing special. By 9:15 it had passed through eleven decisions. Was the address valid? Was stock on hand in the forward pick? Was the line hazmat? Did the customer require an ASN? Was it a rush? Did the rate shop return a rate? Nobody on that floor had ever counted those decisions. The warehouse software had. It just never told anyone the number.
What is cyclomatic complexity? It is that number. Thomas McCabe published it in 1976 as a way to count the independent paths through a piece of code. Fifty years later it is built into nearly every code analysis tool. It also works, with no changes at all, on an order flow. This article covers the software side first, with a worked example. Then it draws the same graph over a warehouse order and counts.
The timing matters. The 2027 Third-Party Logistics Study, released in the first week of October at the CSCMP EDGE conference, asked shippers and 3PLs what blocks wider use of AI. Data quality and availability led at 61 percent. Legacy system integration followed at 54 percent. NTT DATA's Jonathan Whitaker summed it up: the technology is ready, and the foundation underneath it is what lags. A foundation is a set of flows. Most of those flows have never had their branches counted.
What is cyclomatic complexity in code?
McCabe's paper, A Complexity Measure, appeared in IEEE Transactions on Software Engineering in December 1976. He was working at the National Security Agency at the time. His problem was practical. Some programs were far harder to test than their size suggested. Line counts did not explain it. The shape of the control flow did.
So he drew the program as a graph. Every statement, or block of statements that always run together, becomes a node. Every possible jump from one block to the next becomes an edge. Start at the entry node and walk to the exit. The number of distinct ways to make that walk is what he wanted to bound.
The measure he defined is the cyclomatic number of that graph:
V(G) = E - N + 2P
E is the number of edges. N is the number of nodes. P is the number of connected components, which is 1 for a single function. So for one function the formula is E - N + 2.
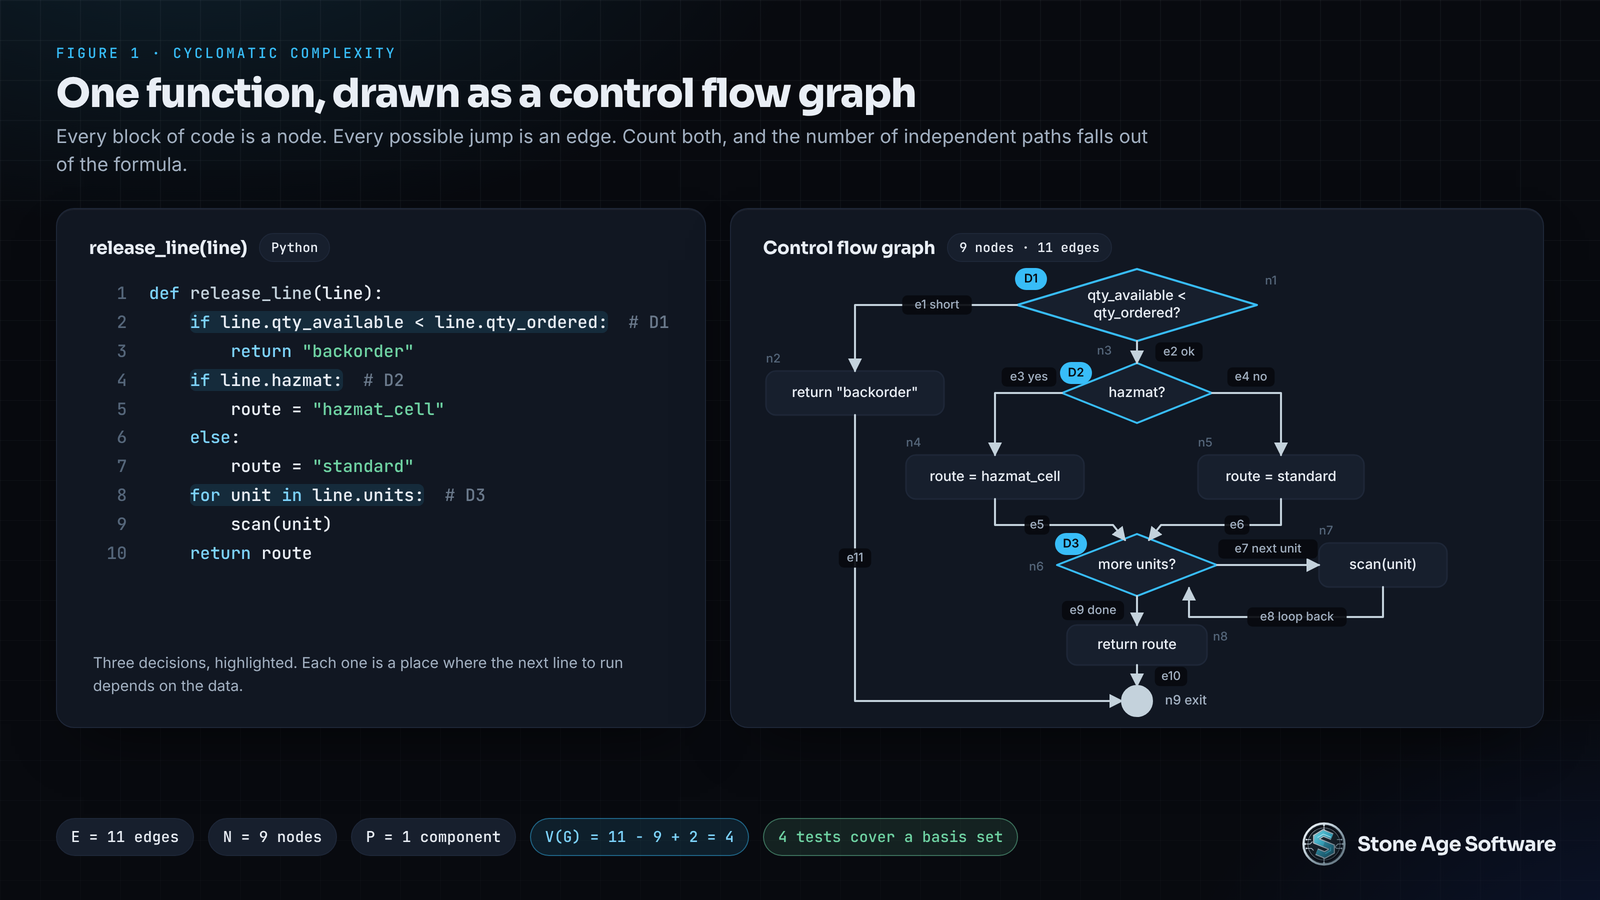
Here is a function that could sit inside any allocation routine. It decides what to do with one order line.
def release_line(line):
    if line.qty_available < line.qty_ordered:
        return "backorder"
    if line.hazmat:
        route = "hazmat_cell"
    else:
        route = "standard"
    for unit in line.units:
        scan(unit)
    return route
Draw it. The stock check is a decision node with two edges leaving it. The hazmat check is another. The loop head is a third, because each pass asks whether there is another unit. Add a single exit node that both return statements flow into. You get nine nodes and eleven edges. V(G) = 11 - 9 + 2 = 4.
Four is the number of linearly independent paths through the function. It is also the number of test cases needed to cover a basis set. One test sends a short line to backorder. One sends a hazmat line with units. One sends a standard line with units. One sends a line with no units at all, which skips the loop. Run those four and every edge in the graph has been exercised at least once.
Three ways to count, and why they agree
The graph formula is exact but slow to apply by hand. Two shortcuts give the same answer for ordinary structured code.
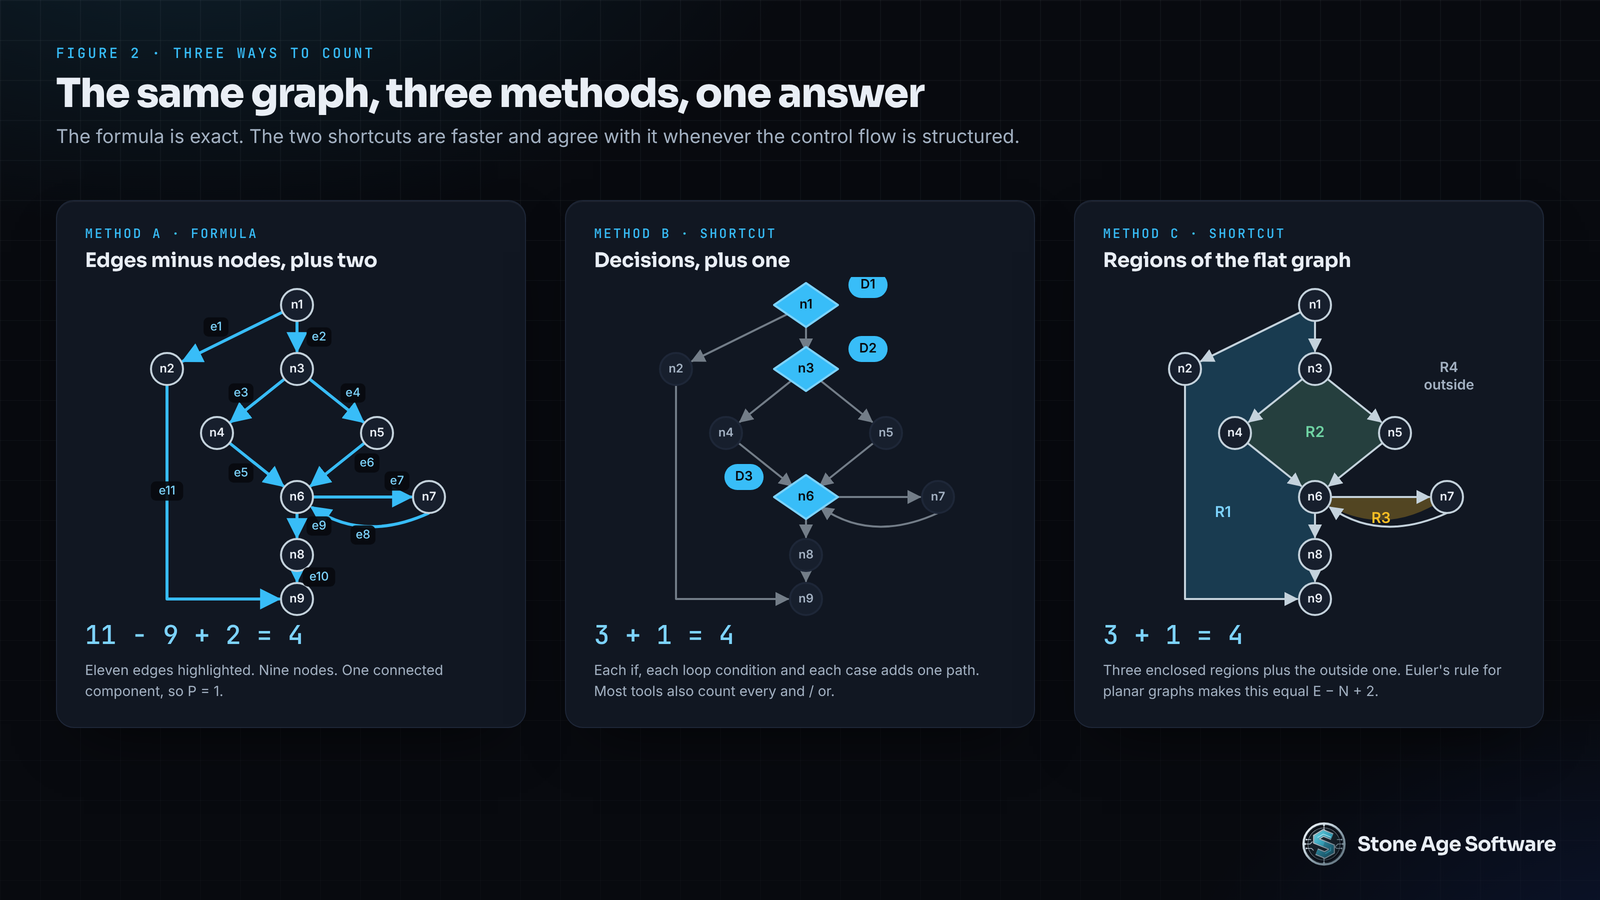
Count the decisions and add one. Every binary decision adds exactly one path. The function above has three decisions, so V(G) = 3 + 1 = 4. Each if, each loop condition and each case in a switch statement counts as one. Most tools also count each and and or inside a condition, because each one is a hidden branch.
Count the regions. Draw the graph flat with no crossing edges. Count the enclosed areas, plus the one outside area. For a single-entry, single-exit graph this equals E - N + 2. The function above encloses three regions, and the outside makes four.
Use the formula. When the control flow is not structured, with jumps out of loops and multiple exits, the two shortcuts drift. The formula still holds. That is why static analysis tools build the graph rather than counting keywords.
The three methods agreeing is not a coincidence. It is a property of planar graphs that Euler worked out in the 1700s. McCabe's contribution was noticing that the property measured something programmers cared about.
How to read the number
McCabe set the working limit at 10. He called it reasonable but not magical. When a module passed 10, his teams split it or rewrote it. The one exception he allowed was a large case statement that followed a single selection, since that shape is wide rather than tangled.
Twenty years later, NIST turned the method into a testing standard. NIST Special Publication 500-235, written by Arthur Watson and McCabe, states the rule plainly. For each module, either limit cyclomatic complexity to 10, or provide a written explanation of why the limit was exceeded. It notes that limits up to 15 have been used successfully. It also records that numerous studies and general industry experience show the measure correlates with errors in software modules.
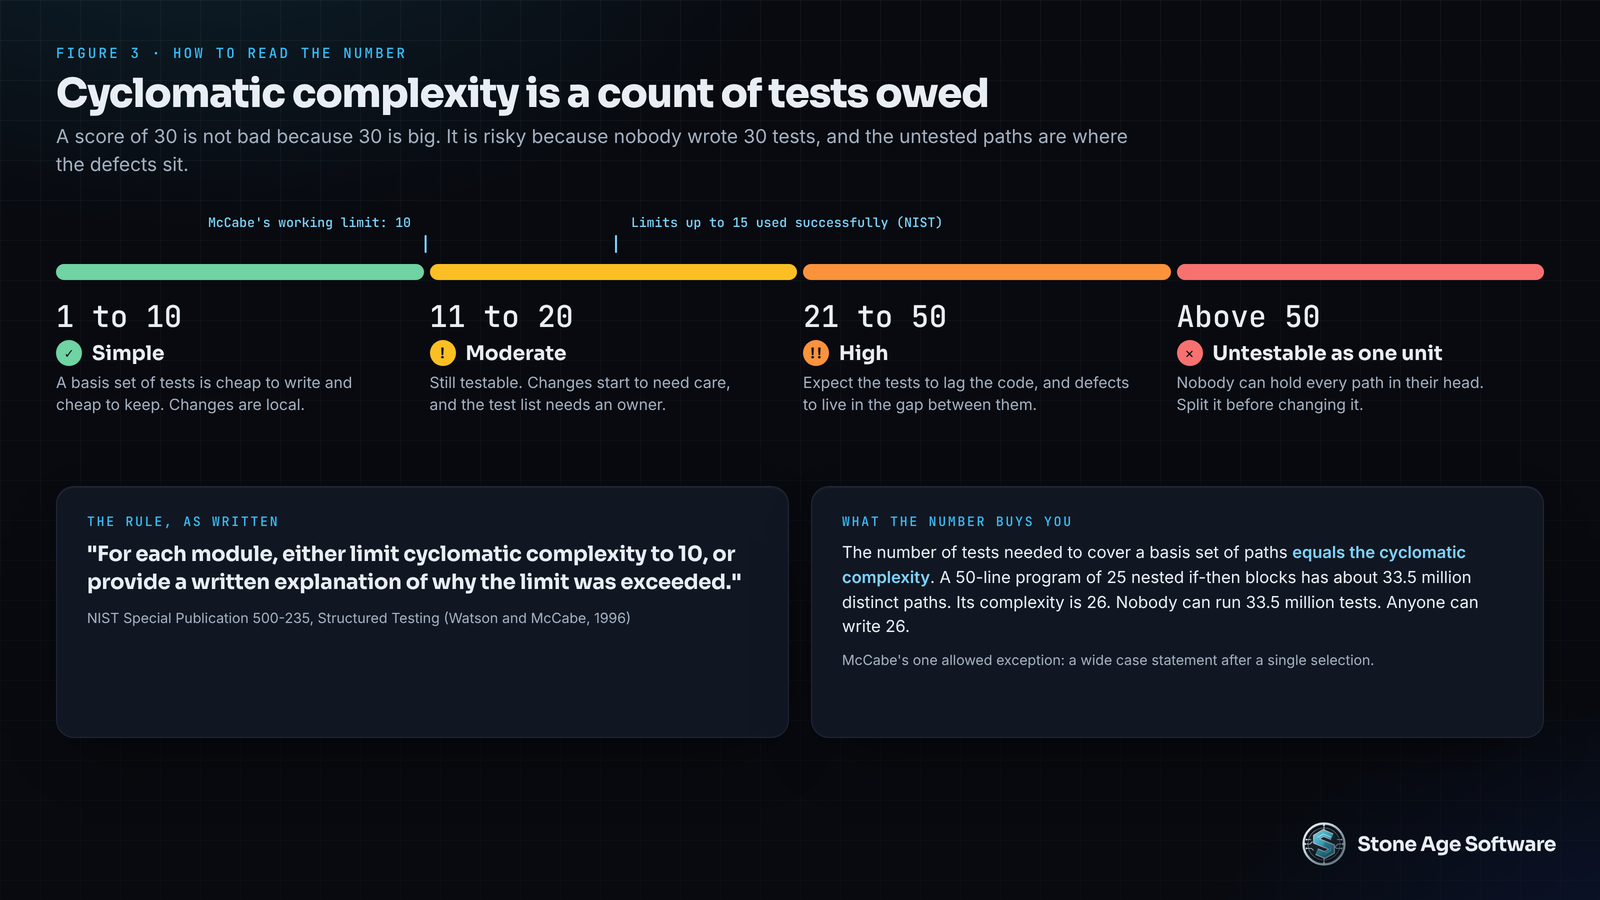
A working scale looks like this:
- 1 to 10. Simple. A basis set of tests is cheap to write and keep.
- 11 to 20. Moderate. Still testable, but changes start to need care.
- 21 to 50. High. Expect the tests to lag the code, and defects to live in the gap.
- Above 50. Effectively untestable as one unit. Nobody can hold every path in their head.
The number is a count of tests owed. That framing keeps it honest. A function at 30 is not bad because 30 is a big number. It is risky because nobody wrote 30 tests, and the paths without tests are where the defects sit.
Cyclomatic versus cognitive
One refinement is worth knowing. Cyclomatic complexity treats a flat switch with ten cases the same as five nested conditions inside each other. Both score about the same. A human reads them very differently. SonarSource published Cognitive Complexity to score readability instead, adding extra weight for nesting. The two numbers answer different questions. Cognitive complexity asks how hard the code is to understand. Cyclomatic complexity asks how many paths you have to prove. For the rest of this article, the second question is the one that matters.
Where to get the number today
You do not have to draw graphs. Python has radon, which prints V(G) per function with one command. JavaScript and TypeScript have the ESLint complexity rule. Visual Studio reports it under code metrics for .NET. Go has gocyclo. SonarQube reports both measures across a whole codebase. Most editors can show the number next to the function name while you type.
That ease is a trap in legacy systems. The number is easy to get and hard to look at. A twenty-year-old stored procedure that runs the allocation for a whole site can score above 100. Nobody on the current team wrote it. Nobody has a test for it. Every change is a guess, and the guesses accumulate. None of that is the team's fault. It is the predictable output of a structure nobody measured.
What the number does not tell you
Four limits are worth stating before applying it anywhere new.
- It does not weight paths by frequency. A path that runs once a year counts the same as the happy path. That is right for testing and wrong for staffing.
- It ignores data complexity. A function with a score of 2 that parses a 400-field EDI segment is still hard.
- It says nothing about whether a branch should exist. Hazmat routing is a branch the law requires. It stays.
- It is measured per module. Splitting a 40 into four 10s does not remove any paths. It changes how many one person must hold, and it gives every path an owner. That is the entire point.
Why paths matter more than lines
McCabe's paper contains a figure that still stops people. A 50-line program made of 25 consecutive if-then constructs has roughly 33.5 million distinct control paths. Its cyclomatic complexity is 26. Nobody can test 33.5 million paths. Anyone can write 26 tests. The basis set is what makes testing a finite job.
The same arithmetic explains why systems rot. Each added flag feels like one line. It is actually one more path, one more test, and one more combination that interacts with every path already there. Add a flag a month for five years and the function has sixty untested paths. The defects that follow are not anyone's fault. They are the output of a structure that grew without a count.
Using the number on a modernization project
The count earns its keep when it meets change history. Sort every module by complexity, then by how often it changed in the last year. The modules that are both complex and busy are the ones to test first and refactor second. A procedure at 60 that nobody has touched since 2019 can wait. A procedure at 25 that changed eleven times last quarter cannot.
That ranking is the first deliverable of most legacy modernization work we take on. It turns an argument about which code is bad into a list with two numbers per row. It also gives the business a sentence it can act on: this routine has 47 paths and tests for 6 of them.
Now draw an order the same way
Here is the move. A supply chain flow is a control flow graph. Every step where work happens is a node. Every handoff is an edge. Every point where an order can go one of two ways is a decision. The formula does not know whether the nodes are lines of code or workstations. It counts paths either way.
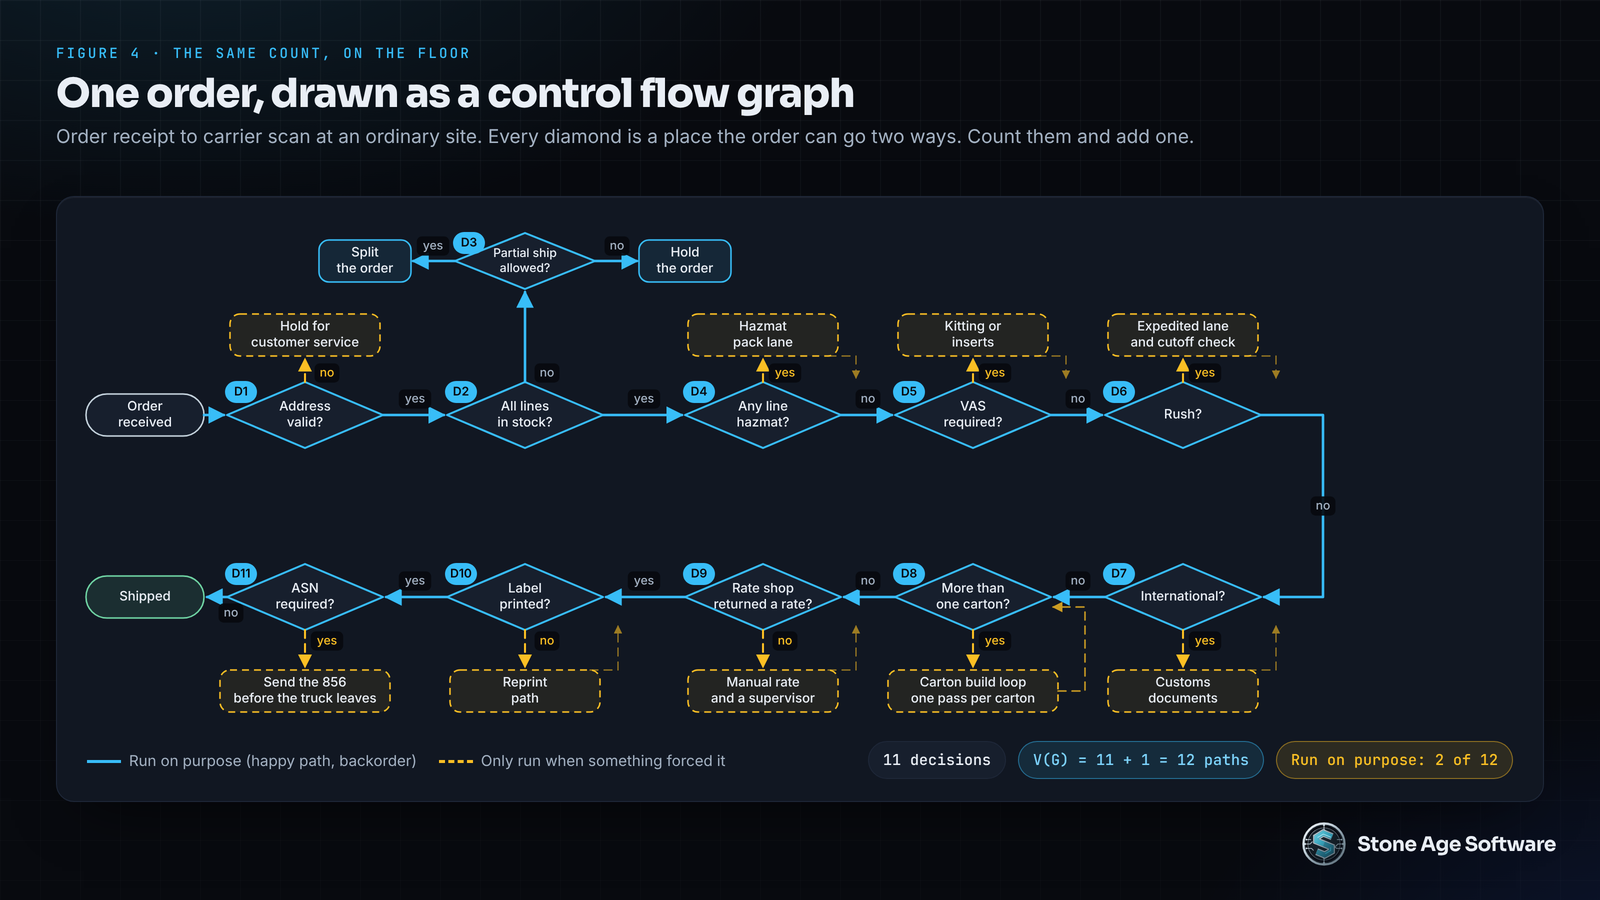
Take the Tuesday order from the opening and walk it.
- Order received. Is the address valid? No: hold for customer service.
- Are all lines in stock? No: is partial shipment allowed for this customer? Yes: split the order. No: hold the whole order.
- Is any line hazmat? Yes: route to the hazmat pack lane.
- Does this customer require a value-added service? Yes: kitting or inserts before pack.
- Is this a rush? Yes: expedited lane and a cutoff check.
- Is it international? Yes: customs documents.
- Does it need more than one carton? Yes: the carton build loop runs once per carton.
- Did the rate shop return a rate? No: manual rate and a supervisor.
- Did the label print? No: reprint path.
- Does the customer require an ASN? Yes: send the 856 before the truck leaves.
- Shipped.
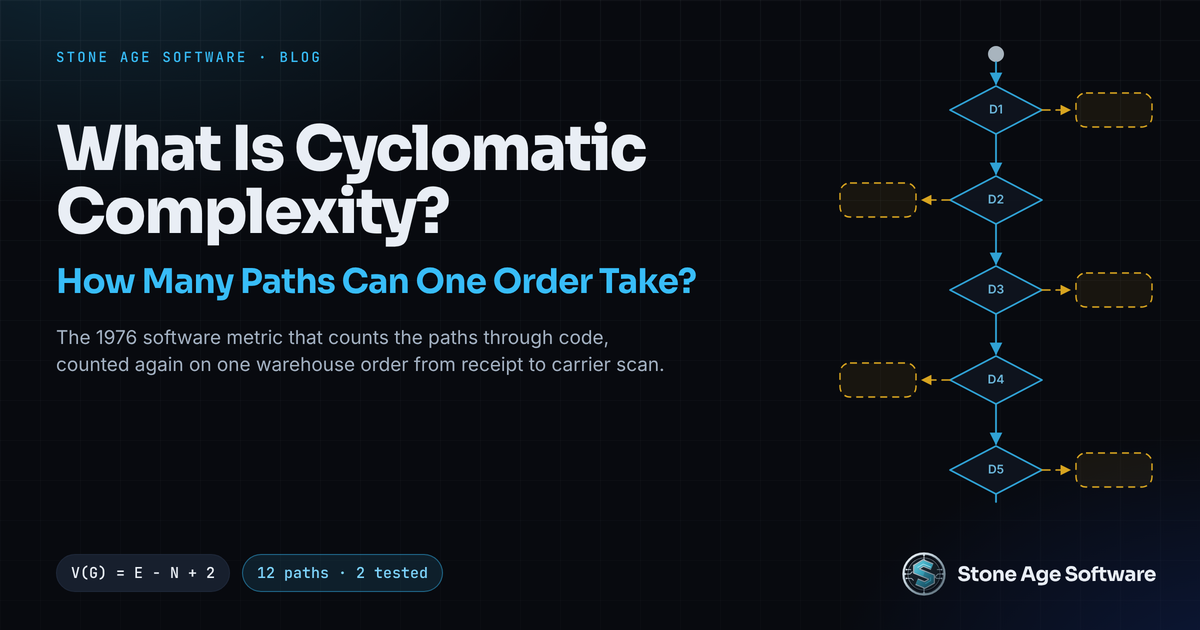
Eleven binary decisions. V(G) = 11 + 1 = 12. There are twelve independent paths through one ordinary order at one ordinary site. The question that follows is the same one NIST asks of a software module. How many of the twelve have been run on purpose?
At most sites the honest answer is two. The happy path runs ten thousand times a day. The backorder path runs often enough to be reliable. The other ten paths run only when something forces them. The customs path runs when an international order shows up. The manual rate path runs when the carrier connection drops. Those paths were never tested. They were survived.
The mapping holds at every level
- An
ifstatement is a decision at a workstation, or a rule in the WMS. - A function is one step of a standard operating procedure.
- A loop is a carton build, or a unit-by-unit scan.
- A switch on customer is a client profile with its own rules.
- An exception handler is an OS&D case, a hold queue, or a supervisor call.
- A module is a lane, a cell, or a team.
- A test case is one order sent down one path on purpose.
Read the floor side of each line again. Every one is a place where a decision lives. Some live in the WMS configuration. Some live in carrier rules. Some live in a customer SOP binder. Some live in one person's head. The decisions that live in people's heads are the ones no graph has ever counted.
Volume is not complexity
This is the part operators find useful. A site that ships 50,000 lines a day down three paths is simple. A site that ships 500 lines a day down twenty paths is complex. Throughput and complexity are different axes. Staffing, automation and slotting all answer the first one. Only structure answers the second.
That is also why the seams between systems are where complexity hides. An order management system makes six decisions. The WMS makes eight. The carrier platform makes four. Each system's paths are tested inside that system. The paths that cross a seam belong to nobody. The OMS says split, and the WMS has no rule for a split. The carrier platform rejects a label, and the WMS has already marked the order shipped. Those gaps do not show up until the graph includes all three systems, which is the drawing a system integration engagement starts with.
A second count: receiving
Run the same exercise inbound. A trailer arrives. Is there an ASN on file? Does the PO match? Does the pallet count match the paperwork? Does the weight? Is anything damaged? Does this client require lot and expiry capture? Does the item cross-dock or go to reserve? Seven decisions, so a score of 8. On paper, receiving is simpler than shipping. In practice it is messier, because its exception paths arrive without warning and leave without a record.
Where the untested paths hide in a 3PL
A 3PL multiplies the problem. Every client brings its own branches. One wants a packing slip with their logo. One requires lot capture on every receipt. One rejects any carton over a weight limit. One needs a specific ASN variant. Call it six client-specific decisions each. Forty clients is 240 added decisions, spread across configuration screens, label templates and emails. No single flow is complex. The product of flows is.
Two patterns from recent builds show what counting does to a flow.
Exceptions that had no graph. A receiving operation handled damage and shortage by email thread. Someone found a problem at the dock. Someone else was told. Weeks later, someone settled the claim with whatever documentation existed. The build that replaced it is described in our OS&D case management case study. It names nine exception types. Seven open a case on their own. A case has nine lifecycle states and three distinct ways to close. That is a counted graph. Before the build, the same decisions existed. They lived in inboxes, where nobody could see which paths had never been run.
A go or no-go rule nobody had written down. The wave planning case study started with a report somebody maintained by hand. It had a go or no-go column per order. No document defined the rule behind it. The team reproduced the column from the underlying data and compared, order by order, until the two agreed on every order but one. That one was a manual override typed into the sheet. This is basis path testing without the vocabulary. Run every order down the rule until each path has produced the expected answer.
Both builds share a shape. The exception paths were extracted into their own module, with their own states and their own owner. The main flow got shorter. Nothing was removed from the operation. The branches were moved to where they could be counted.
What the 3PL study is actually measuring
Return to the hook. The 2027 Third-Party Logistics Study, covered by TheTrucker and summarized in Penske's announcement, found data quality the top barrier at 61 percent and legacy integration next at 54 percent. It also found shippers using predictive analytics at 66 percent against 43 percent for 3PLs. Those numbers are one problem viewed from two sides.
Data from a flow with twelve paths, ten of them untested, is not clean data. The untested paths produce records with blank fields, overridden statuses and timestamps that run backwards. A model trained on that history learns the exceptions as noise. Cleaning the data without fixing the flow is a treadmill. Counting the flow first tells you which paths are generating the noise. That is a structural answer to what looks like a data problem.
Reducing the number: four moves that work in both places
Refactoring has a short list of moves for bringing a function under 10. Each has an exact counterpart on the floor. Two of the moves lower the number. The other two lower the cost of proving each path.
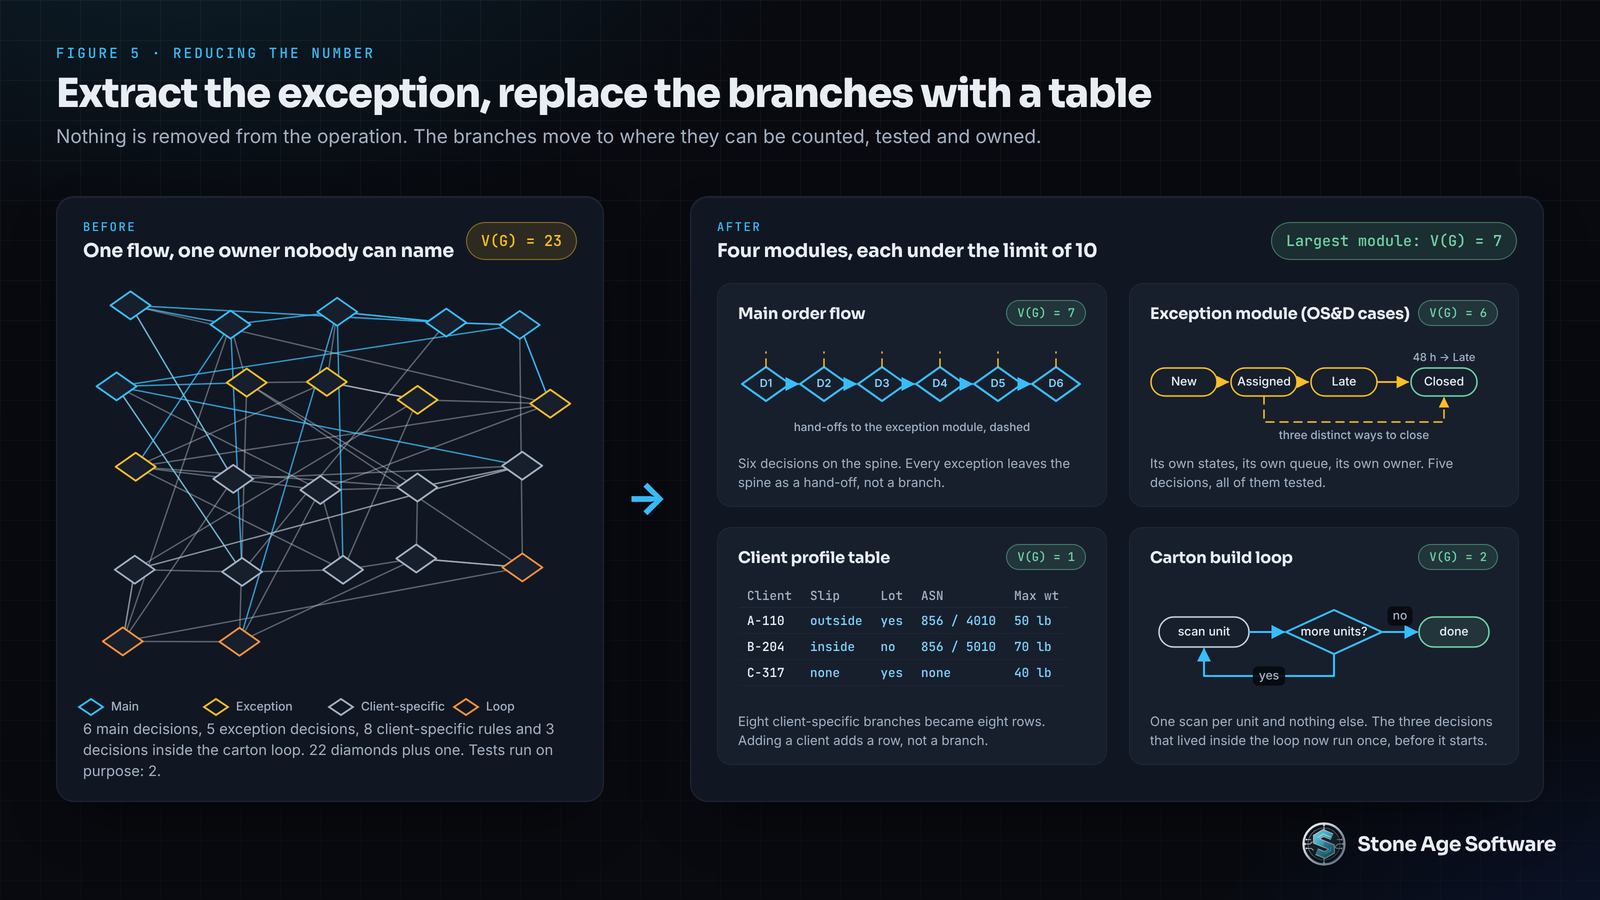
1. Extract the exception. In code, pull the error handling into its own function and call it. The main function's complexity drops by every branch you moved. On the floor, give exceptions their own lane, their own queue and their own owner. The OS&D build above did exactly this. The receiving screen stayed simple. The case manager took the states.
2. Replace nested conditions with a table. A function that checks customer, then region, then service level is three levels deep. A lookup table with one row per combination is one level deep. Adding a customer adds a row rather than a branch. On the floor, that table is a client profile. The WMS reads it. The packer never has to remember that one client wants the slip on the outside.
3. Fail fast at the top. Guard clauses handle the bad inputs first and return. The rest of the function runs on clean data with no nesting. The count stays the same, but every path becomes a one-line test. On the floor, validate the address and confirm stock at order intake, before a pick ticket prints. A hold at intake costs a message. A hold at the pack station costs a tote, a picker and a replan.
4. Keep the loop boring. A loop body that contains decisions multiplies them by every iteration. Make the body do one thing. On the floor, the carton build loop should be one scan per unit and nothing else. Any decision inside it, like whether this unit needs a serial capture, belongs before the loop starts.
And one rule from NIST that is usually forgotten. When a module stays above 10 on purpose, write the explanation down. The customer-specific label routine with forty cases is allowed to exist. The written reason is what stops the next person from refactoring it into something worse.
The goal of all four moves is the same. The person on the floor should handle the one path that needs judgment. The software should handle the eleven that do not. That is what frees a packer to notice the carton that is wrong, instead of remembering which client wants which slip.
A check you can run this week
Count the decisions on one order. It takes about an hour and needs a whiteboard.
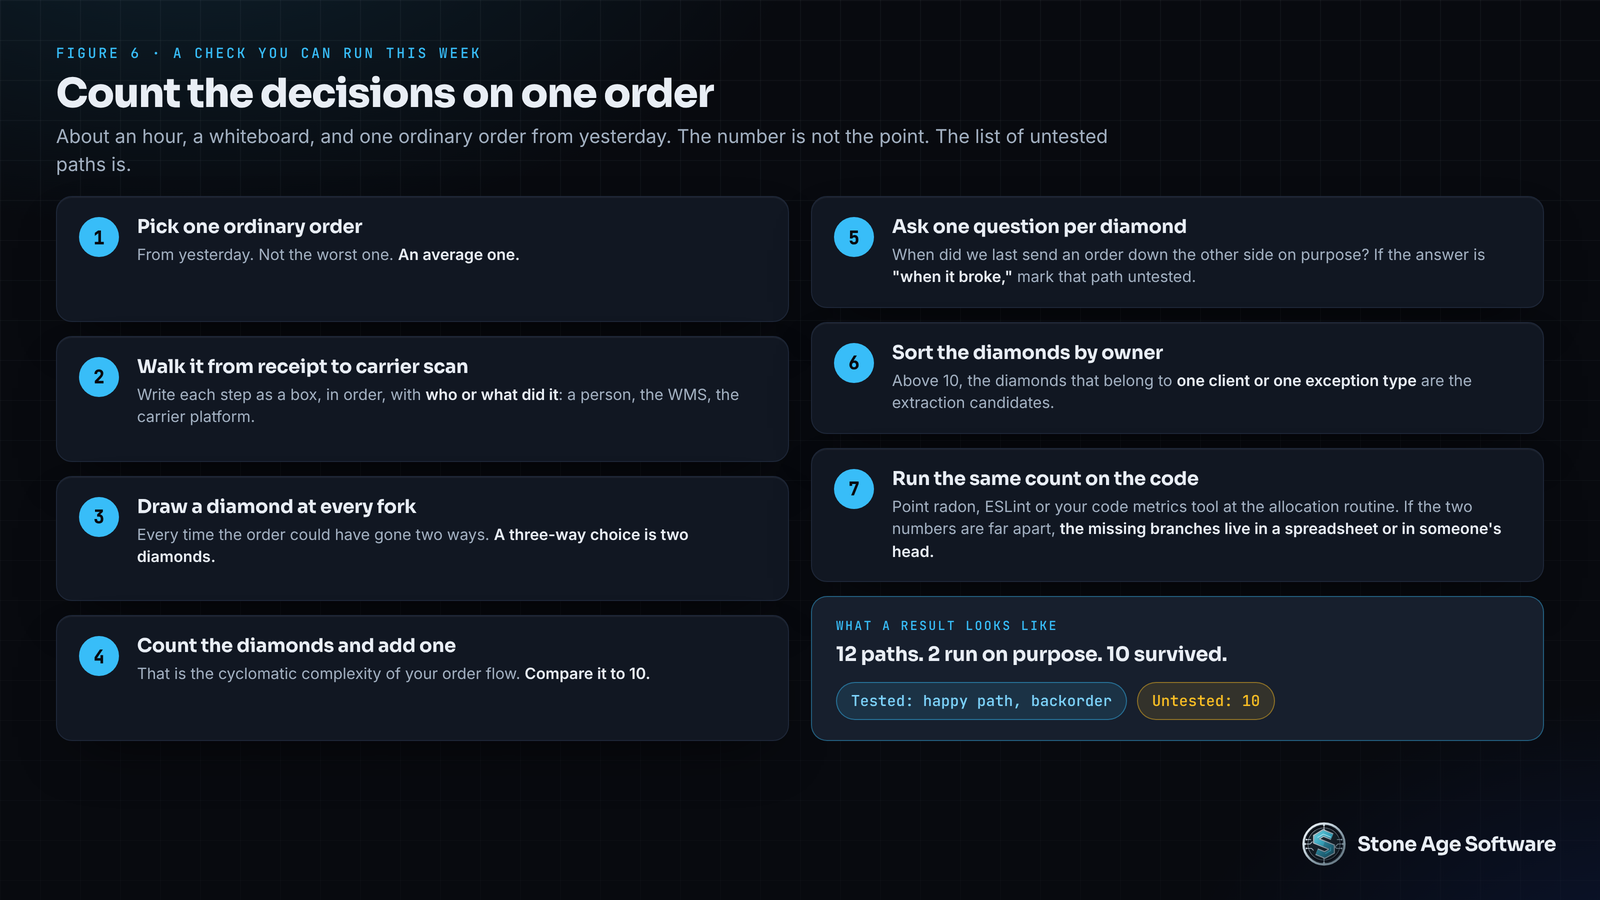
- Pick one ordinary order from yesterday. Not the worst one. An average one.
- Walk it from order receipt to the carrier scan. Write each step as a box, in order, with who or what did it.
- Every time the order could have gone two ways, draw a diamond. A three-way choice is two diamonds.
- Count the diamonds and add one. That is the cyclomatic complexity of your order flow.
- For each diamond, ask one question. When did we last send an order down the other side on purpose? If the answer is "when it broke," mark that path untested.
- If the total is above 10, sort the diamonds by owner. The ones that belong to one client or one exception type are the extraction candidates.
- Run the same count on the code. Point
radon, ESLint or your code metrics tool at the allocation routine. If the software number and the whiteboard number are far apart, the missing branches live in a spreadsheet or in someone's head.
The number itself is not the point. The list of untested paths is. Each one is a place where the next bad day already has a shape.
If the whiteboard came back above 10 and the untested paths cluster around one client or one exception type, that is a structural problem with a known fix. Our 3PL and logistics systems work starts with exactly this graph, drawn against your WMS and your carrier connections. The first project is scoped to one lane, at a fixed price, quoted up front.